. 2020 Feb 5:13:13.
doi: 10.3389/fnmol.2020.00013. eCollection 2020.

Characterizing Adult Cochlear Supporting Cell Transcriptional Diversity Using Single-Cell RNA-Seq: Validation in the Adult Mouse and Translational Implications for the Adult Human Cochlea

Affiliations

Characterizing Adult Cochlear Supporting Cell Transcriptional Diversity Using Single-Cell RNA-Seq: Validation in the Adult Mouse and Translational Implications for the Adult Human Cochlea

Michael Hoa et al. Front Mol Neurosci. .

Erratum in

Abstract

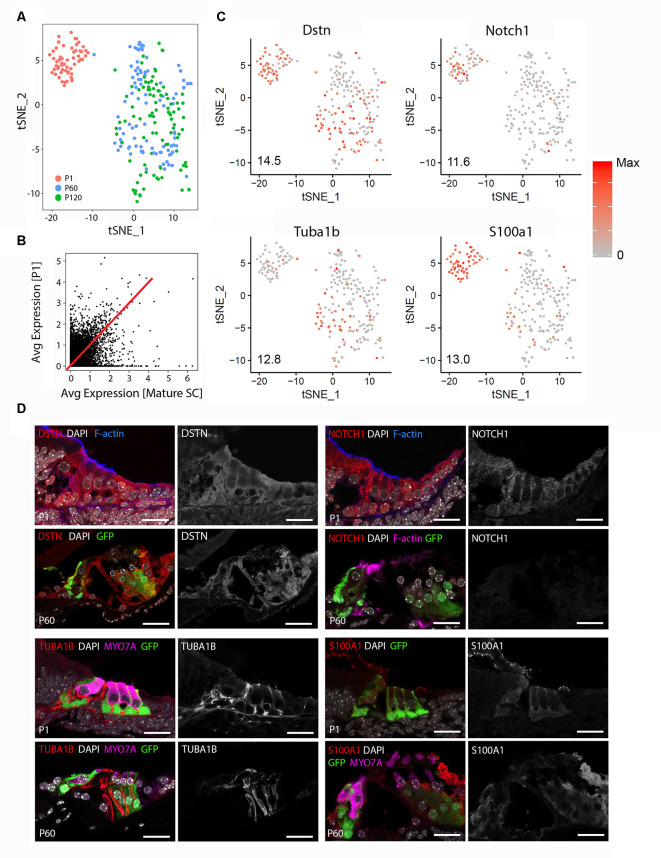
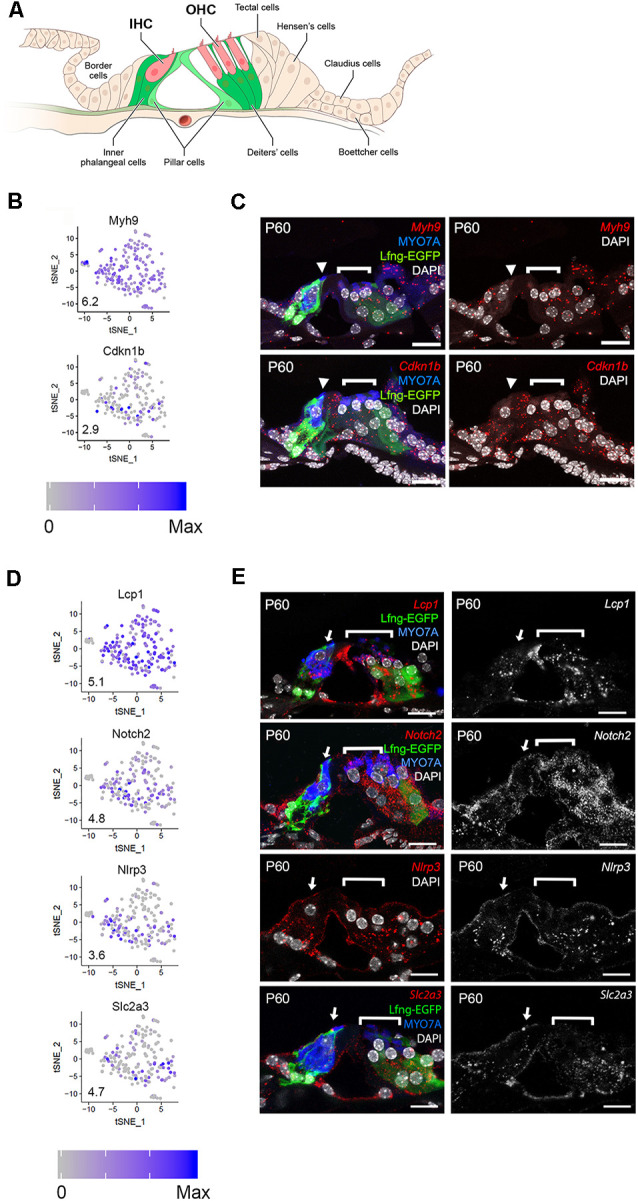
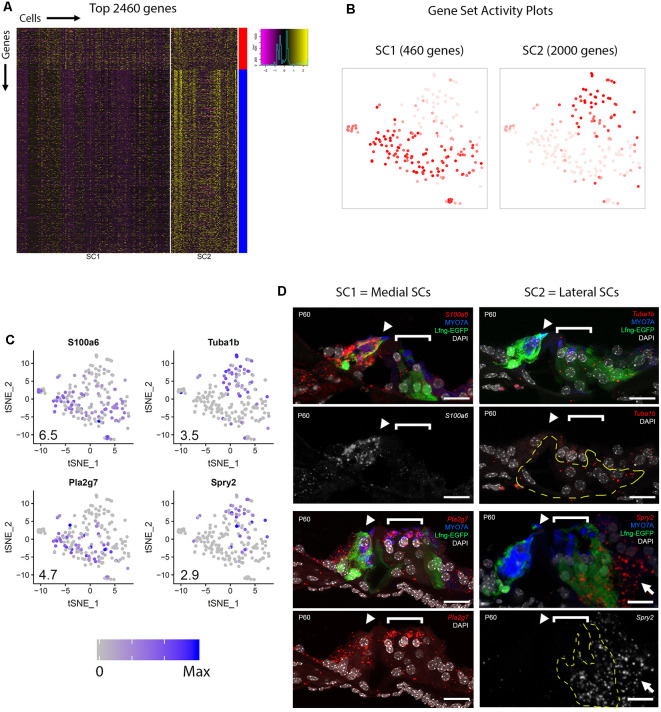
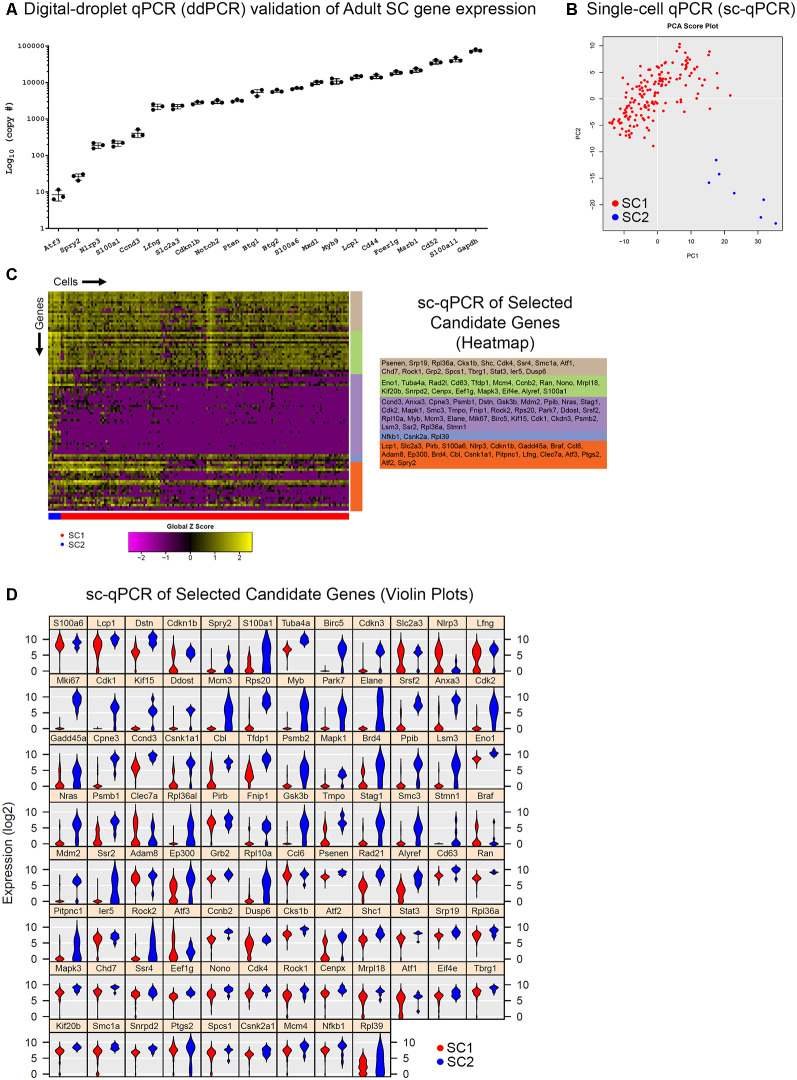
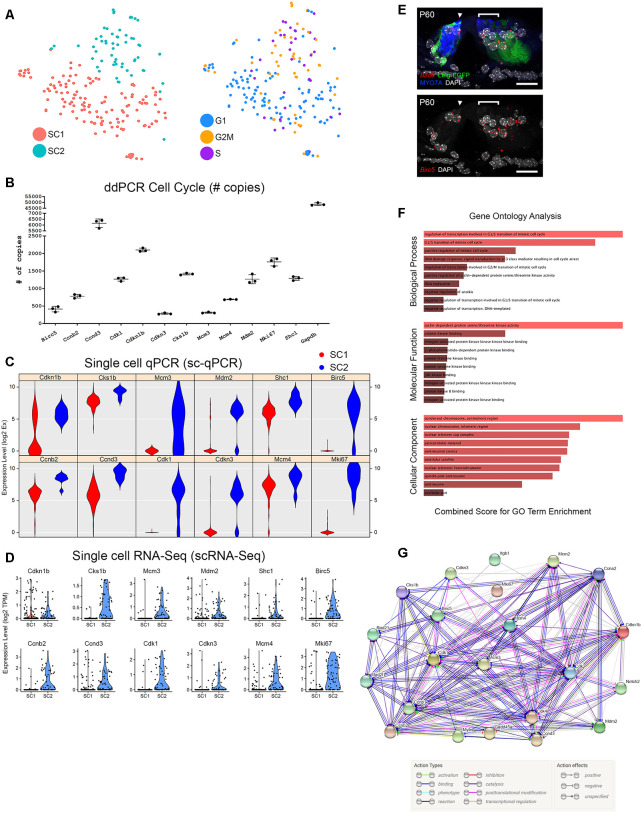
Hearing loss is a problem that impacts a significant proportion of the adult population. Cochlear hair cell (HC) loss due to loud noise, chemotherapy and aging is the major underlying cause. A significant proportion of these individuals are dissatisfied with available treatment options which include hearing aids and cochlear implants. An alternative approach to restore hearing would be to regenerate HCs. Such therapy would require a recapitulation of the complex architecture of the organ of Corti, necessitating regeneration of both mature HCs and supporting cells (SCs). Transcriptional profiles of the mature cell types in the cochlea are necessary to can provide a metric for eventual regeneration therapies. To assist in this effort, we sought to provide the first single-cell characterization of the adult cochlear SC transcriptome. We performed single-cell RNA-Seq on FACS-purified adult cochlear SCs from the LfngEGFP adult mouse, in which SCs express GFP. We demonstrate that adult cochlear SCs are transcriptionally distinct from their perinatal counterparts. We establish cell-type-specific adult cochlear SC transcriptome profiles, and we validate these expression profiles through a combination of both fluorescent immunohistochemistry and in situ hybridization co-localization and quantitative polymerase chain reaction (qPCR) of adult cochlear SCs. Furthermore, we demonstrate the relevance of these profiles to the adult human cochlea through immunofluorescent human temporal bone histopathology. Finally, we demonstrate cell cycle regulator expression in adult SCs and perform pathway analyses to identify potential mechanisms for facilitating mitotic regeneration (cell proliferation, differentiation, and eventually regeneration) in the adult mammalian cochlea. Our findings demonstrate the importance of characterizing mature as opposed to perinatal SCs.

Keywords: FACS; adult (MeSH); cell cycle; cochlea; inner ear; smFISH; supporting cell subtypes.


Figures

Figure 1
Figure 1
Adult cochlear supporting cells (SCs) are transcriptionally distinct from perinatal cochlear SCs. (A) Unbiased clustering of FACS-purified P1 and mature (P60, P120) cochlear SC transcriptomes demonstrates the clustering of single cells based on the transcriptional expression profiles for each cell. Note that P1 and mature cochlear SCs cluster within their respective groups but exhibit distinct clustering from each other. (B) Comparison of averaged gene expression between FACS-purified mature (P60, P120) and P1 cochlear SCs indicates both equivalent (genes expressed on or near the red line) and differential (genes located closer to either axis) expression between the two cell stages. (C) Feature plots of select known cochlear SC genes (Dstn, Notch1, S100a1, Tuba1b) demonstrate distinct differences between P1 and mature cochlear SCs. An expression is shown in log2 [nTPM] with the maximum expression value (Max) shown in the lower-left corner of each plot. The expression histogram is shown with red indicating higher expression. (D) Representative immunohistochemistry validating transcriptional differences between P1 and mature cochlear SCs in the organ of Corti from LfngEGFP mice. Each 4-panel grouping demonstrates P1 and P60 immunohistochemistry with the protein of interest in the red channel (left panels) at P1 (upper left panel) and P60 (lower left panel) and the gray scale single-channel images of the protein of interest (right panels) at P1 (upper right panel) and P60 (lower right panel). Known protein expression (DSTN, NOTCH1, S100A1, TUBA1B) is demonstrated (Upper left Four panels and proceeding clockwise). Staining for F-actin or MYO7A identifies hair cell (HC) stereocilia or HCs, respectively. Scale bar, 20 μm.
Figure 2
Figure 2
Single-cell RNA-Seq identifies adult SC gene expression. (A) Schematic of adult LfngEGFP organ of Corti. GFP-expressing cells include inner phalangeal cells, Deiters’ cells, and, to a lesser extent, pillar cells. IHC = inner hair cell, OHC = outer hair cell. Mice that are homozygous and heterozygous for the transgene display the same phenotype. (B) Expression of genes that are known to be expressed by adult cochlear SCs (Myh9, Cdkn1b). Feature plots show the expression level of each gene in each cell. An expression is shown in log2 [nTPM] with the maximum expression value (Max) shown in the lower-left corner of each plot. The expression histogram is shown with blue indicating higher expression. (C) smFISH localization of RNA expression for Myh9, and Cdkn1b in cross-sections of the adult organ of Corti demonstrates localization in all SCs (border, inner phalangeal, the pillar, and Deiters cells). Upper left image demonstrates the Myh9 probe in red along with Lfng-EGFP in green, antibody labeling forMYO7A (HCs), and DAPI-labeling of nuclei. Lower left image shows the Cdkn1b probe in red, Lfng-EGFP in green, MYO7A (HCs), and DAPI-labeling of nuclei. Upper and lower panels to the right illustrates the smFISH channel with DAPI-labeling of nuclei. (D) Expression of previously uncharacterized adult cochlear SC genes (Lcp1, Notch2, Nlrp3, Slc2a3) presented as in panel (B). (E) smFISH localization of RNA expression for Lcp1, Notch2, Nlrp3, and Slc2a3 in adult cross-sections of the organ of Corti. Images to the right demonstrate the RNA probe of interest in red along with anti-MYO7A (HCs) in blue, Lfng-EGFP in green and DAPI in white where applicable. Images to the right are the smFISH probe alone in grayscale. The IHC (arrowhead) and OHC regions (bracket) are indicated. Myh9 = Myosin heavy chain 9 gene; Cdkn1b = Cyclin-dependent kinase inhibitor 1b gene; Lcp1 = Lymphocyte cytosolic protein 1 gene; Notch2 = Notch receptor 2 gene; Nlrp3 = NLR family pyrin domain containing 3 gene; Slc2a3 = Solute carrier family 2 member 3 gene; MYO7A = myosin 7A protein; DAPI = 4’, 6-diaminodino-2-phenylindole; Scale bars in all panels, 20 μm.
Figure 3
Figure 3
Adult cochlear SCs can be categorized into two subpopulations. (A) Heatmap depicting the top 2,460 genes expressed by the two clusters of adult cochlear SCs (SC1, SC2). For SC1, only 460 genes met criteria for significance, while for SC2, 2,000 genes that met criteria for significance were identified (see “Materials and Methods” section). Cells are arrayed along the horizontal axis and genes are arrayed along the vertical axis. Two main clusters of genes are distinguished by the color bars on the vertical axis to the right of the heatmap with the red bar corresponding to SC2 and the blue bar corresponding to SC2. (B) Gene set activity plots to demonstrate composite gene expression projected onto feature plots in SC1-defining (red bar, 460 genes) and SC2-defining (blue bar, 2,000 genes). Despite the visually apparent presence of some SC1-defining genes in the SC2 cluster of SCs, SC1-defining genes as a composite appear to define the SC1 adult cochlear SC subpopulation. (C) Feature plots of 1 known (Tuba1b) and 3 previously uncharacterized (S100a6, Pla2g7, Spry2) genes show differential expression between SC1 and SC2 SC subpopulations. S100a6 and Pla2g7 correspond to SC1 (red gene cluster in panel A) and Tuba1b and Spry2 correspond to SC2 (blue gene cluster in A). Numbers in the bottom left corner of the feature plots represent maximum expression level (Max) among adult cochlear SCs. The expression histogram is shown with blue indicating higher expression. (D) smFISH localization of RNA expression for these four candidate genes. Below each color image with the RNA probe color designated in italics is either a grayscale single channel of the smFISH RNA probe or the smFISH RNA probe channel with DAPI-labeling of nuclei. S100a6 and Pla2g7 demonstrate higher levels of transcript expression in the medial SCs (inner border, inner phalangeal cells) while Spry2 demonstrates higher levels of transcripts in the lateral SCs (predominantly Deiters cells as denoted by yellow-dashed line outline but also noted in Hensen’s cells as denoted by white arrow). Expression of Tuba1b transcripts can be seen in lateral SCs (pillar and Deiters cells) in the top image with Lfng-EGFP in green, MYO7A in blue (HCs) and DAPI-labeling of nuclei in the top right image for the Tuba1b RNA probe. The region of the lateral SCs (pillar and Deiters cells) is identified by the dashed yellow line in the Tuba1b smFISH probe image with DAPI-labeling of nuclei. HCs are labeled with MYO7A (blue), cell nuclei are labeled with DAPI (white) and Lfng-EGFP transgene expression (green) in SCs. The IHC (arrowheads) and OHC regions (bracket) are indicated. S100a6 = S100 calcium-binding protein a6 gene; Pla2g7 = Phospholipase A2 Group VII gene; Tuba1b = Tubulin alpha 1b gene; Spry2 = Sprouty RTK signaling antagonist 2; MYO7A = myosin 7A protein; DAPI = 4’,6-diaminodino-2-phenylindole; Scale bar in all panels, 20 μm.
Figure 4
Figure 4
Digital droplet PCR (ddPCR) and single-cell quantitative polymerase chain reaction (qPCR) analyses of additional transcripts validate adult cochlear SC scRNA-Seq. (A) Digital droplet PCR (ddPCR) quantification of candidate genes in FACS-purified P60 LfngEGFP-positive cochlear SCs. Absolute quantitation measured in a number of transcript copies detected are plotted on the log base 10 scale on the vertical axis and genes of interest are on the horizontal axis. All candidate genes were detected indicating expression in FACS-purified adult cochlear SCs. (B) Principal component analysis (PCA) of single-cell qPCR (sc-qPCR) of 170 FACS-purified P60 LfngEGFP-positive cochlear SCs corroborates unbiased clustering of single-cell transcriptomes into two clusters (SC1 in red, SC2 in blue). (C) Heatmap of sc-qPCR results with 170 adult cochlear SCs (along the horizontal axis) and 93 candidate genes (along the vertical axis). Candidate gene clusters as determined by hierarchical clustering are noted as the colored bars along the vertical axis of the heatmap. Candidate genes making up the gene clusters are noted to the right of the heatmap in the corresponding colored boxes. As denoted by the expression histogram, the higher the expression, the more yellow the box corresponding to the gene in a given cell. (D) Violin plot display of sc-qPCR results demonstrates candidate gene expression levels in adult cochlear SCs.
Figure 5
Figure 5
Cell cycle analysis of adult cochlear SCs. (A) Analysis of cell cycle phase among FACS-purified adult cochlear SCs reveals that the SC2 cluster of adult cochlear SCs express predominantly S phase and G2/M phase canonical markers compared to SC1 adult cochlear SC cluster. tSNE plot with the clustered cell types is shown to the left with an accompanying tSNE plot demonstrating cells clustered by cell cycle phase to the right. (B) Single-cell RNA-Seq expression of G2/M and S phase-specific markers. Violin plots for a select group of G2/M and S phase-specific cell cycle-related genes demonstrate predominant expression in the SC2 cluster of adult cochlear SCs. For violin plots, expression level (log2 TPM) is displayed on the vertical axis and cell cluster is displayed on the horizontal axis. (C) Single-cell qPCR of FACS-purified adult cochlear SCs for G2/M and S phase cell cycle-related markers confirms gene expression in adult cochlear SCs. Violin plots are redisplayed from Figure 4D for ease of comparison to the scRNA-Seq results above. (D) Digital droplet PCR (ddPCR) quantifies the presence of the select group of cell cycle-related genes validated by sc-qPCR in FACS-purified P60 LfngEGFP-positive cochlear SC populations. (E) Cell cycle gene expression is demonstrated in mid-modiolar sections of the P60 mouse organ of Corti. RNA probe (in red) with accompanying immunohistochemistry is shown in image to the left and grayscale single-channel image is shown in image to the right. smFISH probe for Birc5 (red dots) is shown to overlap with adult cochlear SCs (GFP in green). HCs are labeled with MYO7A (blue) and nuclei are labeled with DAPI (white). Location of IHC (arrowhead) and region of outer HCs (bracket) are denoted. Scale bar in all panels, 20 μm. (F) Gene Ontology (GO) analysis of cell cycle-related genes expressed by FACS-purified GFP-positive cells from P60 LfngEGFP cochlea suggests that these cells may be maintained in a non-proliferative state by a repressive network of genes. All cell cycle genes expressed by adult SCs from the dataset, regardless of which cluster of adult cochlear SCs expressed these genes, were used as the starting input in Enrichr. GO biological process analysis suggests that genes involved in the G1/S transition of the mitotic cell cycle are prominent in adult cochlear SCs. GO molecular function and cellular component analysis point to cyclin-dependent protein serine/threonine kinase activity and cellular components associated with condensed chromatin at the centromere, respectively. The color of the bar corresponds to the combined score which is calculated by taking the log value of the p-value from the Fisher exact test and multiplying this value by the z-score of the deviation from the expected rank. The longer and lighter colored bars indicate that the term is more significant. (G) Use of the STRING database to perform protein-protein interaction analysis identifies a set of interactions that may be related to the persistence of the post-mitotic state in adult cochlear SCs. The STRING plot demonstrates the action types and action effects as noted in the accompanying legend.

References

    1. Atkinson P. J., Huarcaya Najarro E., Sayyid Z. N., Cheng A. G. (2015). Sensory hair cell development and regeneration: similarities and differences. Development 142, 1561–1571. 10.1242/dev.114926 - DOI - PMC - PubMed
    1. Blondel V. D., Guillaume J.-L., Lambiotte R., Lefebvre E. (2008). Fast unfolding of communities in large networks. J. Stat. Mech. Theory Exp. 2008:P10008. 10.1088/1742-5468/2008/10/P10008 - DOI
    1. Burns J. C., Kelly M. C., Hoa M., Morell R. J., Kelley M. W. (2015). Single-cell RNA-seq resolves cellular complexity in sensory organs from the neonatal inner ear. Nat. Commun. 6:8557. 10.1038/ncomms9557 - DOI - PMC - PubMed
    1. Chen P., Segil N. (1999). P27(Kip1) links cell proliferation to morphogenesis in the developing organ of corti. Development 126, 1581–1590. - PubMed
    1. Chen E. Y., Tan C. M., Kou Y., Duan Q., Wang Z., Meirelles G., et al. . (2013). Enrichr: interactive and collaborative HTML5 gene list enrichment analysis tool. BMC Bioinformatics 14:128. 10.1186/1471-2105-14-128 - DOI - PMC - PubMed