. 2020 Feb 4:10:1693.
doi: 10.3389/fphar.2019.01693. eCollection 2019.

Corilagin Alleviates Nonalcoholic Fatty Liver Disease in High-Fat Diet-Induced C57BL/6 Mice by Ameliorating Oxidative Stress and Restoring Autophagic Flux

Affiliations

Corilagin Alleviates Nonalcoholic Fatty Liver Disease in High-Fat Diet-Induced C57BL/6 Mice by Ameliorating Oxidative Stress and Restoring Autophagic Flux

Rong Zhang et al. Front Pharmacol. .

Abstract

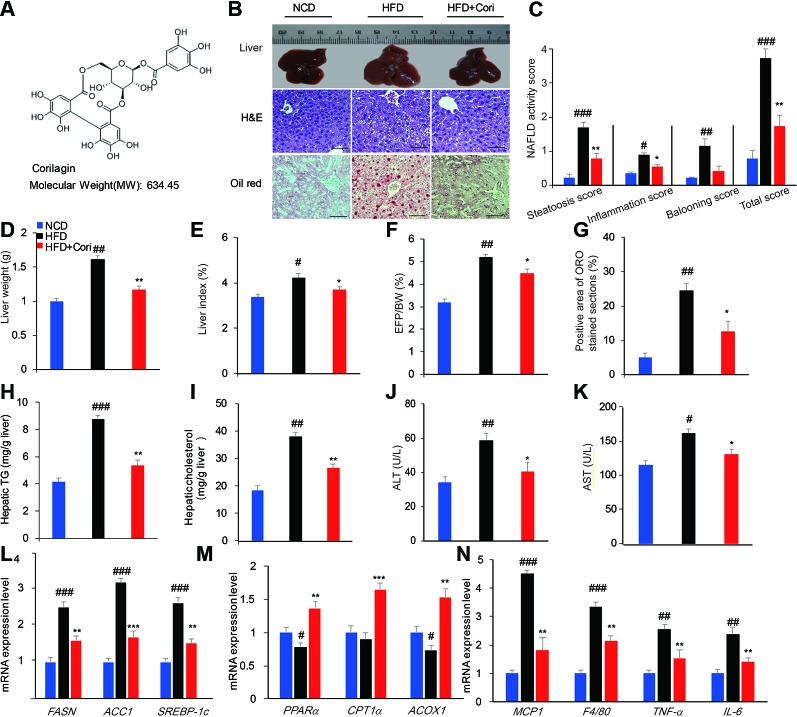
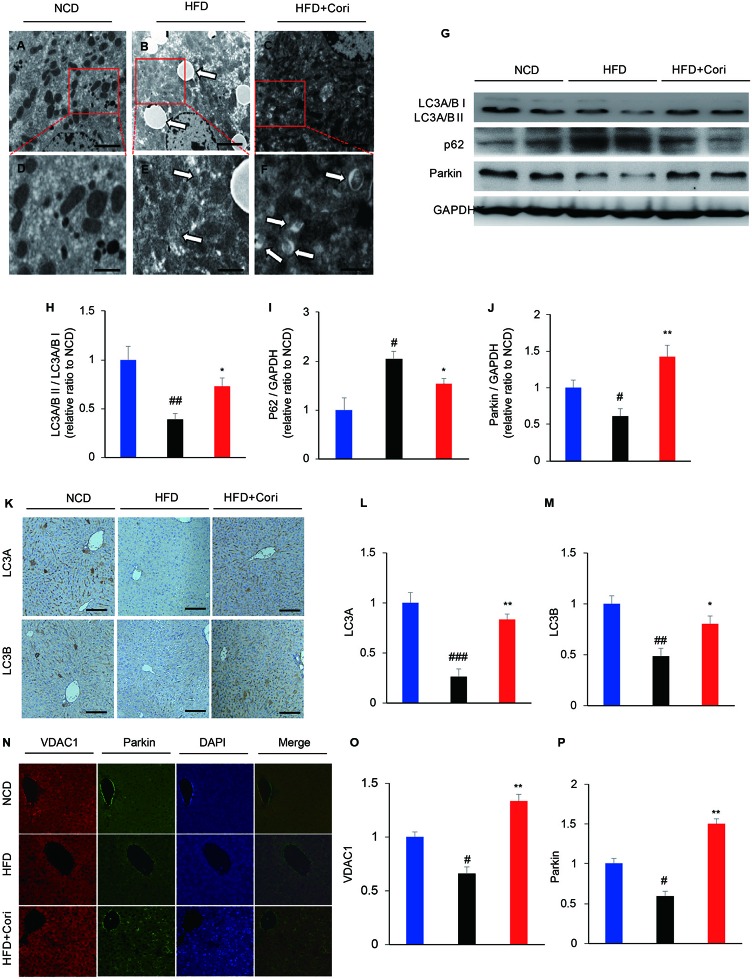
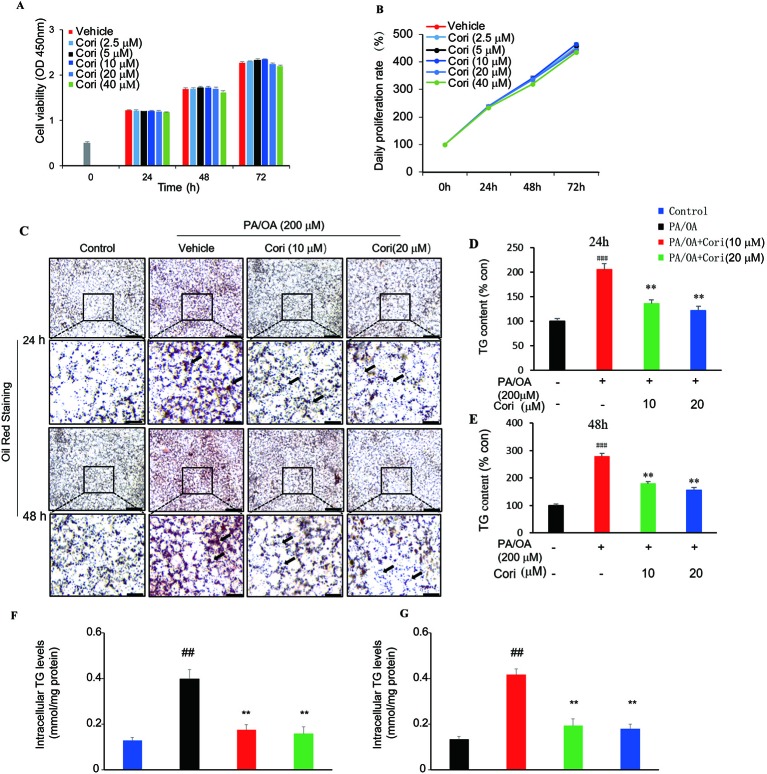
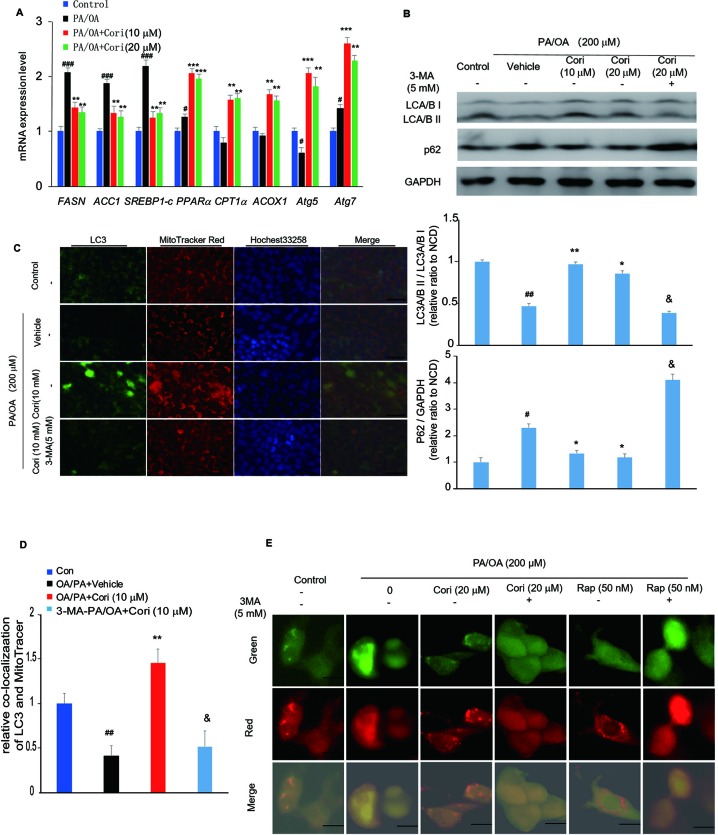
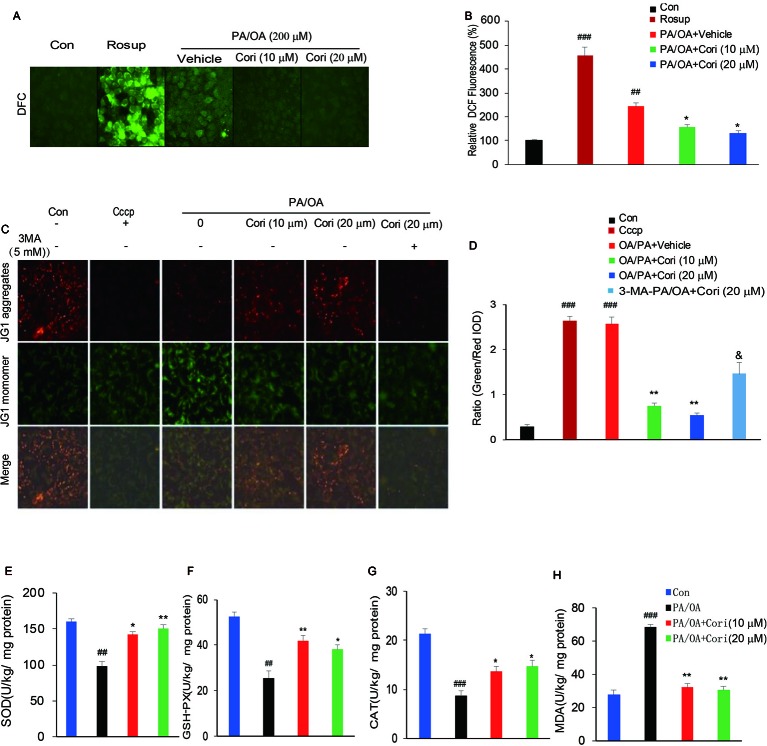
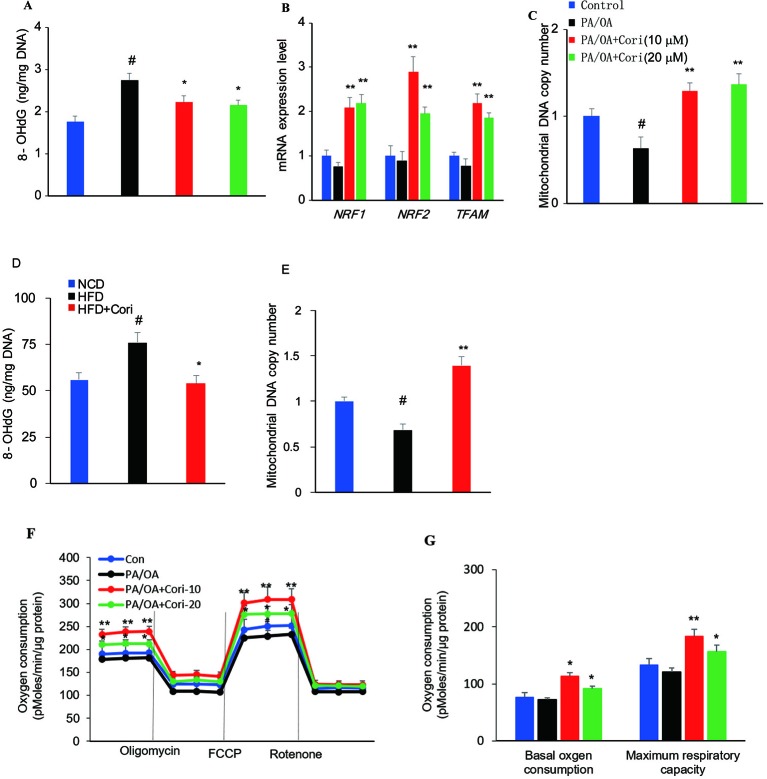
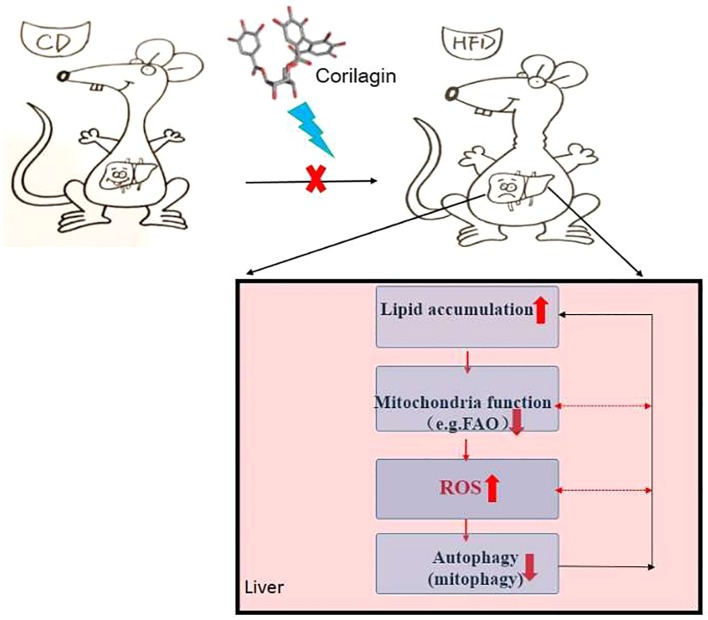
Corilagin (Cori) possesses multiple biological activities. To determine whether Cori can exert protective effects against nonalcoholic fatty liver disease (NAFLD) and its potential mechanisms. C57BL/6 mice were fed with high-fat diet (HFD) alone or in combination with Cori (20 mg/kg, i.p.) and AML12 cells were exposed to 200 μM PA/OA with or without Cori (10 μM or 20 μM). Phenotypes and key indicators relevant to NAFLD were examined both in vivo and in vitro. In this study, Cori significantly ameliorated hepatic steatosis, confirmed by improved serum lipid profiles, and hepatic TC, TG contents, and the gene expression related to lipid metabolism in livers of HFD mice. Moreover, Cori attenuated HFD-mediated autophagy (including mitophagy) blockage by restoring autophagic flux, evidenced by increased number of autophagic double vesicles containing mitochondria, elevated LC3II protein levels, decreased p62 protein levels, as well as enhanced colocalization of autophagy-related protein (LC3, Parkin) and mitochondria. In accordance with this, Cori also reduced the accumulation of ROS and MDA levels, and enhanced the activities of antioxidative enzymes including SOD, GSH-Px, and CAT. In addition, Cori treatment improved mitochondrial dysfunction, evidenced by increased mitochondrial membrane potential (ΔΨm). In parallel with this, Cori decreased mitochondrial DNA oxidative damage, while increased mitochondrial biogenesis related transcription factors expression, mitochondrial DNA content and oxygen consumption rate (OCR). In conclusion, these results demonstrate that Cori is a potential candidate for the treatment of NAFLD via diminishing oxidative stress, restoring autophagic flux, as well as improving mitochondrial functions.

Keywords: Corilagin; autophagy; mitochondrial dysfunction; nonalcoholic fatty liver disease; oxidative stress.


Figures

Figure 1
Figure 1
Cori ameliorates hepatic lipid accumulation in livers of high-fat diet (HFD)-induced C57BL6 mice. 6-week-old male C57BL/6 mice (n = 30) were fed with normal chow diet (normal chow diet [NCD] group, n = 10) or high fat diet (HFD group, n = 20) for 10 weeks. HFD mice were then randomly divided into HFD fed only group (HFD group, n = 10) and HFD plus intraperitoneally injected Cori (20 mg/kg/day, interval for 48 h) group (HFD+Cori group), and maintained for another 8 weeks. The mice fed with NCD were add to serve as a control. (A) Chemical structure of Cori, and CAS number :23094-69-1. (B) Liver gross morphology, liver sections by H&E staining, hepatosteatosis by Oil-red O(ORO)staining (Scale bar = 20 μm). (C) Nonalcoholic fatty liver disease (NAFLD) activity was scored based on steatosis score, inflammation score and ballooning score. (D) Liver weights of each group. (E) Liver index was calculated as the ratio of liver weight to body weight (%). (F) Epididymal fat index was calculated as the ratio of epididymal fat to body weight (%). (G) Positive area of ORO stained section (%). (H, I) Hepatic triglycerides (TG) and cholesterol (TC) content in the liver homogenates of each group. (J, K) Biochemical analysis of alanine aminotransferase (ALT) and aspartate aminotransferase (AST). (L–N) Real-time PCR (RT-PCR) analysis of lipogenic genes (FASN, ACC1, and SREBP-1c) and genes involved in β-oxidation of fatty acids (PPARα, CPT1α, ACOX1) and genes related to proinflammatory cytokines (MCP1, F4/80, TNF-α, IL-6). All data are presented as means ± SD (n = 10 mice/group). #p < 0.05, ##p < 0.01, ###p < 0.001 vs. NCD group; *p < 0.05, **p < 0.01, ***p < 0.001 vs. HFD group.
Figure 2
Figure 2
Cori ameliorated lipid deposition by enhancing autophagy levels in liver of high-fat diet (HFD)-induced C57BL6 mice. (A–F) Transmission electron micrographic (TEM) analysis of liver sections from normal chow diet (NCD) mice (A, highlighted in D), HFD mice (B, highlighted in E), HFD+Cori mice (C, highlighted in F). (A–C magnification × 5 × 10³; D–F magnification ×2×10⁴). The white arrows highlight lipid droplets (B), deformed mitochondria (E) or autophagosomes (F). Scale bars = 2 μm (A–C) and 0.5 μm (D–F). (G) Western blot and (H–J) semiquantitative analysis of autophagy related protein LC3A/B I, LC3A/B II, p62, Parkin in livers of each group. GAPDH was detected as a loading control (H–J). (K) Immunohistochemistry and (L, M) quantitative analysis of LC3A, LC3B in livers of each group. Images of cells were visualized by fluorescent microscope (magnification ×200). (N) Immunofluorescence and (O, P) quantitative analysis of Parkin (green) and the mitochondrial marker VDAC1 (red) in liver of mice (yellow/orange positive fields represented Parkin/VDAC1 double labeled mitochondria). Images of cells were visualized by fluorescent microscope (magnification ×400). All data are presented as means ± SD (n = 10 mice/group). #p < 0.05, ##p < 0.01, ###p < 0.001 vs. NCD group; *p < 0.05, **p < 0.01 vs. HFD group.
Figure 3
Figure 3
Cori attenuated PA plus OA-induced intracellular lipid deposition in AML12 cells. (A, B) AML12 cells were treated with different concentrations of Cori (0, 2.5, 5, 10, 20, 40 μg/ml) for 24, 48, and 72 h, respectively. The relative cell viability was measured by CCK-8 assay. (C) AML12 cells were exposed to a mixture of 200 μM PA/OA in the presence or absence of Cori (10, 20 μM) for 24, 48h, respectively. Lipid droplets accumulation within the AML12 cells were determined by Oil-red O staining. AML12 cells cultured in standard medium were add to serve as the control. (D–G) Intracellular triglycerides (TG) contents were quantified by its optical density (OD) value at 540 nm (D, E) and by Triglyceride assay kit (F, G). Data were presented as mean ± SD of three independent experiments; each performed in triplicates. ###p < 0.001, ##p < 0.01 vs. control group; **p < 0.01 vs. PA/OA only group (F, E).
Figure 4
Figure 4
Cori ameliorated nonalcoholic fatty liver disease (NAFLD) by restoring autophagic flux in vitro. (A) AML12 cells were treated with 200 μM PA/OA in the absence or presence of Cori (10 or 20 μM) for 24 h. The relative expression levels of lipogenic genes (SREBP-1c, ACC1, and FASN), gene involved in β-oxidation of fatty acids (CPT1α, PPARα, ACOX1), and autophagy-related protein (Atg7, Atg5) were determined by RT-PCR assay. (B) Cells were exposed to 200 μM PA/OA and in the presence or absence of Cori (10 or 20 μM) for 24 h. 3-MA (5 mM) were add to serve as autophagic inhibitor. Western blot and semiquantitative analysis of autophagy related protein LC3A/B I, LC3A/B II, p62 in hepatocytes of each group. GAPDH was detected as a loading control. (C) Immunofluorescence stained with antibodies against LC3 (green) and the mitochondrial marker MitoTracker (red) in AML12 cells. (D) Quantitative analysis of yellow/orange positive fields represented LC3/MitoTracker double labeled mitochondria from (C). Images of cells were visualized by fluorescent microscope. (E) Cells were mixed with Ad-mCherryGFP-LC3B and then treated with Cori for 24 h, the mCherry (red) and GFP (green) were analyzed by fluorescence microscopy (Scale bar = 20 μm). Data were presented as mean ± SD of three independent experiments; #p < 0.05, ##p < 0.01, ###p < 0.001 vs. NCD group; *p < 0.05, **p < 0.01, ***p < 0.001 vs. high-fat diet (HFD) group. &p < 0.05 vs. HFD group.
Figure 5
Figure 5
Cori protected against PA/OA induced reactive oxygen species (ROS) overproduction, decline in mitochondrial membrane potential as well as antioxidative defense system. (A, B) AML12 cells were exposed to 200 μM PA/OA in the absence or presence of Cori (10 or 20 μM) for 24 h. ROS-sensitive fluorescent probe DCFH-DA was used to detect intracellular ROS levels. Rosup was add to serve as the positive control. Images of cells were visualized by fluorescent microscope. (C, D) AML12 Cells were exposed to 200 μM PA/OA in the absence or presence of Cori (10 or 20 μM) for 24 h. JC-1 was used to monitor mitochondrial membrane potential in cells. Autophagic inducer Cccp (10 μM) or autophagic inhibitor 3-MA (5 mM) was add to serve as the positive or negative control, respectively. Images of cells were visualized by fluorescent microscope. (E–H) AML12 Cells were exposed to 200 μM PA/OA in the absence or presence of Cori (10 or 20 μM) for 24 h. The effects of Cori on SOD (E), GSH-Px (F), CAT (G), and malondialdehyde (MDA) (H) levels were determined by ELISA assay. The data was presented as mean ± SD of three independent experiments; each performed in sextuplica. ##p < 0.01, ###p < 0.001 vs. control group; *p < 0.05, **p < 0.01 vs. PA/OA only group. &p < 0.05 vs. Cori (20 μM) group.
Figure 6
Figure 6
Cori protected against reactive oxygen species (ROS)-induced mitochondrial dysfunction in AML12 cells. (A–C) AML12 cells were exposed to 200μM PA/OA in the presence or absence of Cori (10 or 20 μM) for 24 h. The levels of oxidative DNA damage marker 8-OHdG were determined by ELISA assay (A). Real-time PCR (RT-PCR) analysis of genes involved in mitochondrial biogenesis, including NRF1, NRF2, Tfam (B). RT-PCR analysis of mtDNA copy number (C). (D) The levels of oxidative DNA damage marker 8-OHdG in livers. (E) The levels of mitochondrial mtDNA in livers. (F) Mitochondrial respiration capacity was determined by Seahorse assay. (G) Basal OCR is [OCR with substrates - OCR with rotenone and antimycin A] and maximal respiratory capacity is [OCR with FCCP - OCR with rotenone and antimycin A]. Data were presented as mean ± SD of three independent experiments; each performed in sextuplica. #p < 0.05 vs. control group; *p < 0.05, **p < 0.01 vs. PA/OA only group.
Figure 7
Figure 7
A self-perpetuating vicious cycle in the development and progression of nonalcoholic fatty liver disease (NAFLD). In the case of hypernutrition, mitochondrial adaptations (e.g., increased mitochondrial fatty acid oxidation, mtFAO) are initiated to curb fat accumulation in livers. However, this adaption secondarily induces excessive reactive oxygen species (ROS) production, thus leading to the aggravation of mitochondrial dysfunction. Underlying mitochondrial dysfunction could further accelerate ROS overproduction and the progression of NAFLD. On the other hand, ROS potentiates the dual role in the initiation of autophagy and suppression of autophagic flux. Overproduction of ROS continuously attacks mitochondria, causing mitochondrial fatigue and mitochondrial decompensation, which promotes lipid overload and lipotoxicity and eventually blocks the autophagic flux. Meanwhile, defective autophagy alters lipid homeostasis, which contributes to the lipid accumulation in liver. In this study, the Chinese herb, Corilagin (Cori) exerts the effects on alleviating lipid deposition in livers of high-fat diet (HFD) induced C57BL/6 mice via diminishing oxidative stress, restoring autophagic flux arrest, as well as improving mitochondrial functions.

References

    1. Begriche K., Massart J., Robin M. A., Bonnet F., Fromenty B. (2013). Mitochondrial adaptations and dysfunctions in nonalcoholic fatty liver disease. Hepatology 58, 1497–1507. 10.1002/hep.26226 - DOI - PubMed
    1. Bellentani S. (2017). The epidemiology of non-alcoholic fatty liver disease. Liver Int. 37 Suppl 1, 81–84. 10.1111/liv.13299 - DOI - PubMed
    1. Braud L., Battault S., Meyer G., Nascimento A., Gaillard S., de Sousa G., et al. (2017). Antioxidant properties of tea blunt ROS-dependent lipogenesis: beneficial effect on hepatic steatosis in a high fat-high sucrose diet NAFLD obese rat model. J. Nutr. Biochem. 40, 95–104. 10.1016/j.jnutbio.2016.10.012 - DOI - PubMed
    1. Cai N., Zhao X., Jing Y., Sun K., Jiao S., Chen X., et al. (2014). Autophagy protects against palmitate-induced apoptosis in hepatocytes. Cell Biosci. 4, 28. 10.1186/2045-3701-4-28 - DOI - PMC - PubMed
    1. Cicero A. F. G., Sahebkar A., Fogacci F., Bove M., Giovannini M., Borghi C. (2019). Effects of phytosomal curcumin on anthropometric parameters, insulin resistance, cortisolemia and non-alcoholic fatty liver disease indices: a double-blind, placebo-controlled clinical trial. Eur. J. Nutr. 10.1007/s00394-019-01916-7 - DOI - PMC - PubMed