. 2020 Feb 14:11:88.
doi: 10.3389/fphys.2020.00088. eCollection 2020.

Tuft Cell Formation Reflects Epithelial Plasticity in Pancreatic Injury: Implications for Modeling Human Pancreatitis

Affiliations

Tuft Cell Formation Reflects Epithelial Plasticity in Pancreatic Injury: Implications for Modeling Human Pancreatitis

Kathleen E DelGiorno et al. Front Physiol. .

Abstract

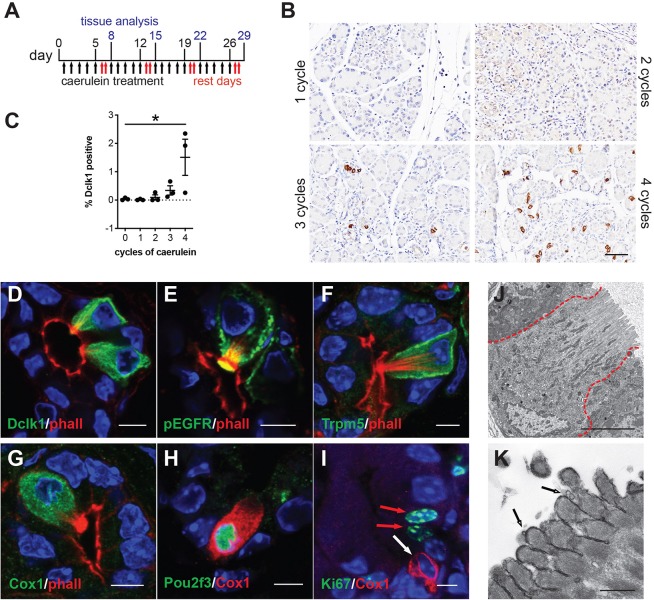
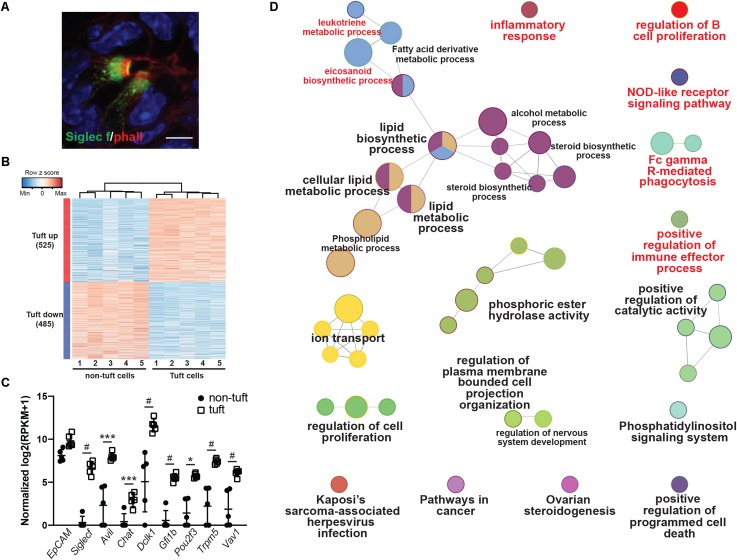
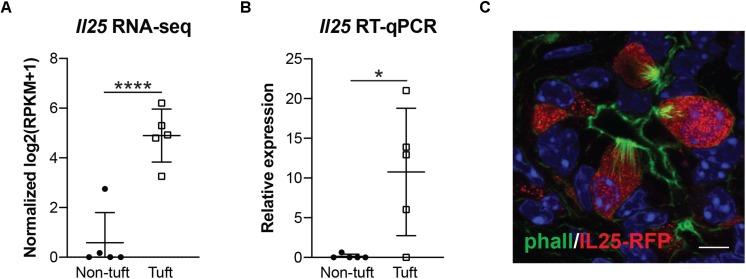
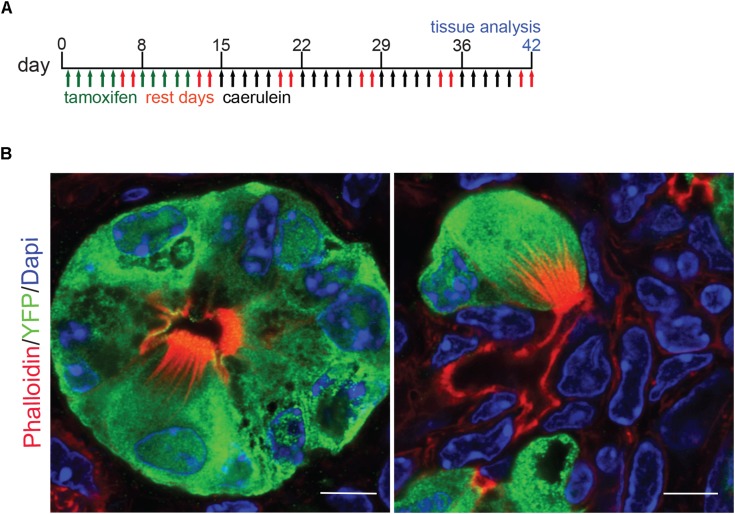
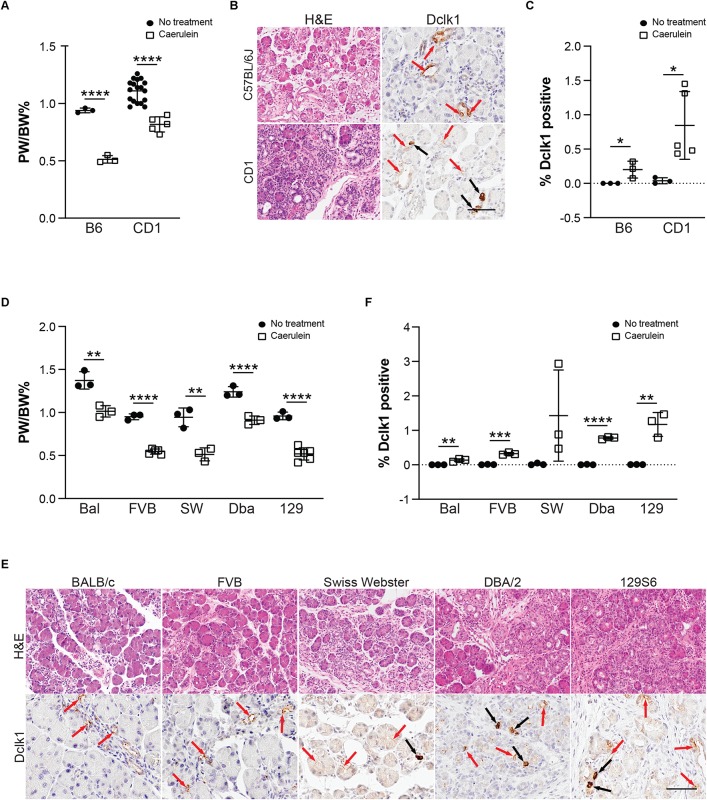
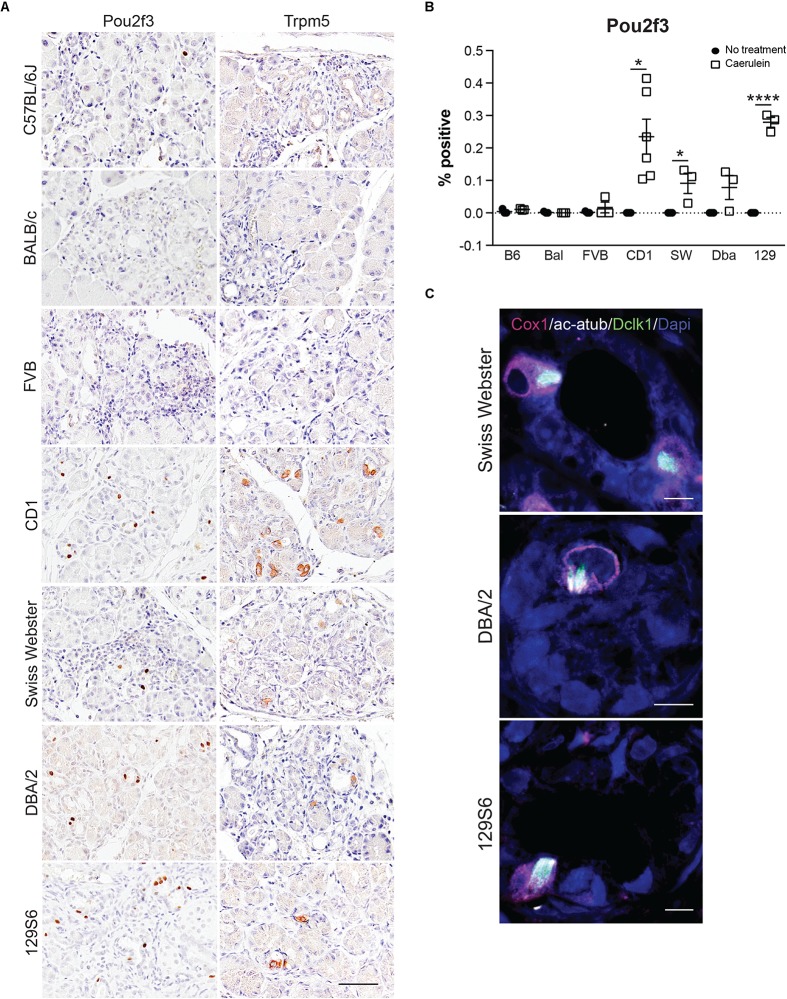
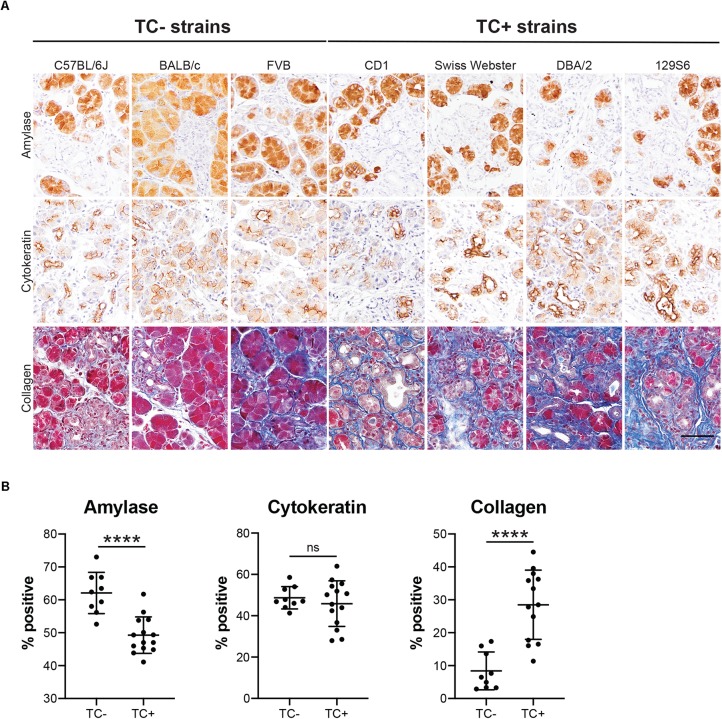
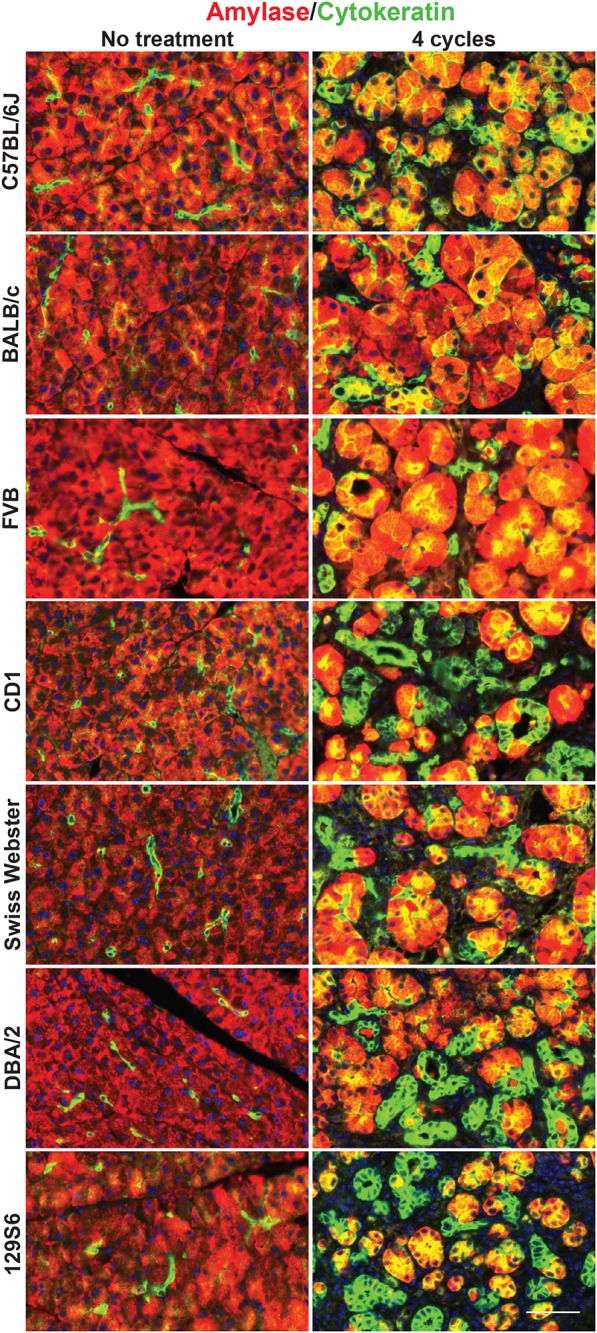
Chronic pancreatitis, a known risk factor for the development of pancreatic ductal adenocarcinoma (PDA), is a serious, widespread medical condition characterized by inflammation, fibrosis, and acinar to ductal metaplasia (ADM). ADM is a cell type transdifferentiation event where pancreatic acinar cells become ductal-like under conditions of injury or oncogenic mutation. Here, we show that chronic pancreatitis and ADM in genetically wild type mice results in the formation of a significant population of chemosensory tuft cells. Transcriptomic analyses of pancreatitis tuft cells identify expression of inflammatory mediators, consistent with a role for tuft cells in injury progression and/or resolution. Though similar to tuft cell populations in other organs and disease systems, we identified a number of key differences that suggest context-specific tuft cell functions. We evaluated seven different mouse strains for tuft cell formation in response to chronic injury and identified significant heterogeneity reflecting varying proclivity for epithelial plasticity between strains. These results have interesting implications in the role of epithelial plasticity and heterogeneity in pancreatitis and highlight the importance of mouse strain selection when modeling human disease.

Keywords: Dclk1; metaplasia; mouse models; pancreatitis; tuft cells.


Figures

FIGURE 1
FIGURE 1
Chronic injury induces tuft cell formation in the pancreata of wild type mice. (A) Schematic of caerulein treatment for pancreatitis induction in wild type mice. (B) Immunohistochemistry (IHC) demonstrating an increase in Dclk1 expression (brown) in the injured pancreas over time and quantified in (C) (n = 3 mice per condition). Scale bar, 50 μm. (D) Co-immunofluorescence (Co-IF) for tuft cell marker phalloidin (red, labels the microvilli and actin rootlets of tuft cells) and Dclk1, (E) phospho-EGFR, (F) Trpm5, or (G) Cox1 (green). (H) Co-IF for tuft cell marker Cox1 (red) and Pou2f3 or (I) Ki67 (green). Red arrows, Ki67 + nuclei, white arrow, Ki67- tuft cell. Scale bars, 5 μm. (J) Electron microscopy confirming tuft cell formation in pancreatitis, and (K) demonstrating the presence of vesicles at the tips of the microvilli (arrows). Scale bars, 5 μm and 500 nm, respectively.
FIGURE 2
FIGURE 2
Transcriptomic analysis of pancreatitis-induced tuft cells in wild type CD1 mice. (A) Co-immunofluorescence for phalloidin (red, labels the microvilli and actin rootlets of tuft cells) and Siglec f (green) in the injured pancreas. Scale bar, 5 μm. (B) Heat map with hierarchical clustering showing differentially expressed genes in EpCAM+; Siglec f+ tuft cells as compared to EpCAM+; Siglec f-neg non-tuft epithelial cells. (C) Confirmation of Siglec f expression and tuft cell markers in sorted EpCAM+; Siglec f+ cells. n = 5 mice. (D) Gene ontology network analysis of genes differentially up-regulated in tuft cells, as compared to non-tuft epithelial cells, identifies immune cell signaling pathways (labeled in red). *p < 0.05; ***p < 0.005; #p < 0.001.
FIGURE 3
FIGURE 3
Pancreatitis-induced tuft cells in wild type CD1 mice express cytokine IL-25. (A) RNA-seq demonstrating significantly higher expression of Il25 in tuft cells (EpCAM+; Siglec f+ cells) as compared to non-tuft epithelial cells (EpCAM+; Siglec f-neg cells). (B) RT-qPCR confirms significantly higher Il25 expression in tuft cells. (C) Co-immunofluorescence for red fluorescent protein (RFP, red) and phalloidin (green) in Il25F25/F25 mice with pancreatitis. Scale bar, 5 μm. *p < 0.05; ****p < 0.001.
FIGURE 4
FIGURE 4
Lineage tracing of pancreatitis tuft cells in wild type mice reveals acinar cell origin. (A) Schematic of tamoxifen and caerulein treatment for lineage tracing in Ptf1aCreERTM/+; RosaYFP mice. (B) Co-immunofluorescence for tuft cell marker phalloidin (red, labels the microvilli and actin rootlets of tuft cells) and YFP, green, in caerulein-treated pancreata. Scale bar, 5 μm.
FIGURE 5
FIGURE 5
Tuft cell formation in response to pancreatitis in wild type mice is strain-dependent. (A) Pancreas: Body weight ratio (PW/BW) changes in C57BL/6J (B6) and CD1 mice in response to four cycles of caerulein treatment. (B) H&E and IHC for tuft cell marker Dclk1 in caerulein-treated C57BL/6J and CD1 mice showing expression consistent with tuft cell morphology (black arrows) as well as non-tuft cells (red arrows), quantified in (C). (D) Pancreas: Body weight ratio (PW/BW) changes in an additional five mouse strains in response to four cycles of caerulein treatment. (E) H&E and IHC for tuft cell marker Dclk1 in the same caerulein-treated mouse strains. Cells with tuft cell morphology (black arrows), non-tuft cells (red arrows). Dclk1 IHC quantified in (F). Bal, BALB/c; SW, Swiss Webster; Dba, DBA/2; 129, 129S6. Scale bar, 50 μm. *p < 0.05, **p < 0.01; ***p < 0.005; ****p < 0.001.
FIGURE 6
FIGURE 6
Tuft cell marker expression in response to pancreatitis in wild type mice is strain-dependent. (A) IHC for tuft cell markers Pou2f3 and Trpm5 in all strains. Scale bar, 50 μm. (B) Quantification of Pou2f3 IHC in all seven strains of mice. (C) Co-immunofluorescence for tuft cell markers Cox1 (pink), acetylated α-tubulin (white), and Dclk1 (green). Scale bar, 5 μm. Bal, BALB/c; SW, Swiss Webster; Dba, DBA/2; 129, 129S6. *p < 0.05; ****p < 0.001.
FIGURE 7
FIGURE 7
Epithelial and stromal marker expression in caerulein-induced pancreatitis varies by mouse strain. (A) IHC for acinar cell marker amylase or ductal cell marker cytokeratin (both brown), or collagen staining (Trichrome, blue) in the pancreata of mice treated with four cycles of caerulein, quantified in (B). Scale bar, 50 μm. TC–, measurements from mouse strains lacking tuft cells (C57BL/6J, BALB/c, and FVB); TC+, measurements from mouse strains that form tuft cells in response to caerulein (CD1, Swiss Webster, DBA/2, 129S6). ****p < 0.01; ns, not significant.
FIGURE 8
FIGURE 8
Co-expression of acinar and ductal markers in the normal or injured pancreata of wild type mice. Immunofluorescence for acinar cell marker amylase (red) or ductal cell marker cytokeratin (green) in the pancreata of untreated or treated (four cycles of caerulein) mice from all seven strains. Cells co-positive for amylase and cytokeratin appear yellow. Scale bar, 50 μm.

References

    1. Bailey J. M., Alsina J., Rasheed Z. A., McAllister F. M., Fu Y. Y., Plentz R., et al. (2014). DCLK1 marks a morphologically distinct subpopulation of cells with stem cell properties in preinvasive pancreatic cancer. Gastroenterology 146 245–256. 10.1053/j.gastro.2013.09.050 - DOI - PMC - PubMed
    1. Benatar T., Cao M. Y., Lee Y., Lightfoot J., Feng N., Gu X., et al. (2010). IL-17E, a proinflammatory cytokine, has antitumor efficacy against several tumor types in vivo. Cancer Immunol. Immunother. 59 805–817. 10.1007/s00262-009-0802-8 - DOI - PMC - PubMed
    1. Bezencon C., Furholz A., Raymond F., Mansourian R., Metairon S., Le Coutre J., et al. (2008). Murine intestinal cells expressing Trpm5 are mostly brush cells and express markers of neuronal and inflammatory cells. J. Comp. Neurol. 509 514–525. 10.1002/cne.21768 - DOI - PubMed
    1. Bindea G., Mlecnik B., Hackl H., Charoentong P., Tosolini M., Kirilovsky A., et al. (2009). ClueGO: a cytoscape plug-in to decipher functionally grouped gene ontology and pathway annotation networks. Bioinformatics 25 1091–1093. 10.1093/bioinformatics/btp101 - DOI - PMC - PubMed
    1. Bornstein C., Nevo S., Giladi A., Kadouri N., Pouzolles M., Gerbe F., et al. (2018). Single-cell mapping of the thymic stroma identifies IL-25-producing tuft epithelial cells. Nature 559 622–626. 10.1038/s41586-018-0346-1 - DOI - PubMed