. 2020 Feb 11:11:7.
doi: 10.3389/fimmu.2020.00007. eCollection 2020.

Indirect Impact of PD-1/PD-L1 Blockade on a Murine Model of NK Cell Exhaustion

Affiliations

Indirect Impact of PD-1/PD-L1 Blockade on a Murine Model of NK Cell Exhaustion

Maite Alvarez et al. Front Immunol. .

Abstract

The induction of exhaustion on effector immune cells is an important limiting factor for cancer immunotherapy efficacy as these cells undergo a hierarchical loss of proliferation and cytolytic activity due to chronic stimulation. Targeting PD-1 has shown unprecedented clinical benefits for many cancers, which have been attributed to the prevention of immune suppression and exhaustion with enhanced anti-tumor responses. In this study, we sought to evaluate the role of the PD-1/PD-L1 pathway in murine natural killer (NK) cell activation, function, and exhaustion. In an in vivo IL-2-dependent exhaustion mouse model, neutralization of the PD-1/PD-L1 pathway improved NK cell activation after chronic stimulation when compared to control-treated mice. These cells displayed higher proliferative capabilities and enhanced granzyme B production. However, the blockade of these molecules during long-term in vitro IL-2 stimulation did not alter the progression of NK cell exhaustion (NCE), suggesting an indirect involvement of PD-1/PD-L1 on NCE. Given the expansion of CD8 T cells and regulatory T cells (Tregs) observed upon acute and chronic stimulation with IL-2, either of these two populations could influence NK cell homeostasis after PD-L1/PD-1 therapy. Importantly, CD8 T cell activation and functional phenotype were indeed enhanced by PD-1/PD-L1 therapy, particularly with anti-PD-1 treatment that resulted in the highest upregulation of CD25 during chronic stimulation and granted an advantage for IL-2 over NK cells. These results indicate a competition for resources between NK and CD8 T cells that arguably delays the onset of NCE rather than improving its activation during chronic stimulation. Supporting this notion, the depletion of CD8 T cells reversed the benefits of PD-1 therapy on chronically stimulated NK cells. These data suggest a bystander effect of anti-PD1 on NK cells, resulting from the global competition that exists between NK and CD8 T cells for IL-2 as a key regulator of these cells' activation. Thus, achieving an equilibrium between these immune cells might be important to accomplish long-term efficacy during anti-PD-1/IL-2 therapy.

Keywords: CD8; NK; PD-1/PD-L1 pathway; chronic stimulation; exhaustion.


Figures

Figure 1
Figure 1
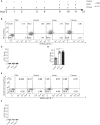
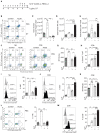
PD-1 and PD-L1 expression patterns on NK cells after chronic IL-2 stimulation. C57BL/6 were treated acutely or chronically with IL-2 or PBS (control) following the regimen dose explained in (A) and spleens were collected 24 h after the last treatment to analyze NK cell phenotype and function by flow cytometry. (A) IL-2 NCE mouse model regimen dose. (B) Representative dot plots on gated NK cells (CD45+TCRβNK1.1+) of PD-1 and PD-L1 are shown. (C,D) Total percentage of PD-1 (C) and PD-L1 (D) is shown for gated NK cells. (E) Representative dot plots on gated NK cells (CD45+TCRβNK1.1+) of PD-1 and PD-L2 are shown. (F) Total percentage of PD-L2 is shown for gated NK cells. Data are representative of five independent experiments with 3–4 mice per group (mean ± SEM). One-way ANOVA was used to assess significance. Significant differences are displayed for comparisons with the acute group ***p < 0.001).
Figure 2
Figure 2
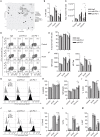
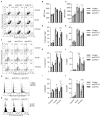
Neutralization of the PD-1/PD-L1 axis ameliorates NK cell exhaustion phenotype after chronic IL-2 stimulation. C57BL/6 mice were given two doses of anti-PD-1, anti-PD-1, or rIgG a day prior to starting IL-2 regimen dosage (Figure 1A) and 5 days after the initial mAb doses. Spleens were again collected 24 h after the last IL-2 treatment as previously explained. (A) Principal component analysis (PCA) of rIgG-treated (circle), anti-PD-L1-treated (square) and anti-PD-1-treated (triangle) NK cells after control (gray), acute (white), or chronic (black) IL-2 stimulation is shown. The data represent the weight that the flow cytometer analyzed NK cell parameters (loading vectors: eigenvectors) have on the PCA distribution. (B,C) Total percentage (B) and the total number (C) of NK cells (CD45+TCRβNK1.1+) is shown after IL-2 stimulation in the spleen. (D–F) Representative dot plots (D) and MFI (E,F) expression for Eomes and T-bet are shown on gated Eomes+ or T-bet+ NK cells, respectively. (G–I) Representative dot plots (G), total percentage (H), and MFI (I) are shown for NKG2D on gated NK cells. (I) Total percentage of KLRG1+ NK cells is shown on gated NK cells (J–L) Representative histograms (J) and the total percentage of GranB (K) as well as IFNγ (L) are shown for gated NK cells (CD3CD49b+) after NK1.1 stimulation. (M) Ki67 expression is shown for gated NK cells. Data are representative of three independent experiments with 3–4 mice per group (mean ± SEM). Two-way ANOVA was used to assess significance. Significant differences are displayed for comparisons with the rIgG-treated group (*p < 0.05, **p < 0.01, ***p < 0.001).
Figure 3
Figure 3
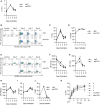
PD-1 blockade does not alter the timeline for NK cell exhaustion during in vitro long-term stimulation. Thy1.2 NK cells were cultured with IL-2 in the presence of anti-PD-1 or isotype control, as explained in the Materials and Methods section. Adherent NK cells were collected at different time points and analyzed by flow cytometry. (A) The expression of PD-1 on NK cells is shown. (B–D) Representative dot plots (B), and the total percentage of GranB (C) and IFNγ (D) producing NK cells after NK1.1 stimulation are shown. (E) Representative dot plots of Eomes and T-bet are shown for gated NK cells. (F,G) The MFI of Eomes (F) and T-bet (G) on Eomes+ or T-bet+ NK cells is shown, respectively. (H–J) The total percentage of the other hallmarks of NCE (NKG2D, KLRG1, and Ki67) are shown on gated NK cells. (K) The percentage of lysis of CFSE-labeled Yac1 cells is shown at different effector:target (E:T) ratios. Data are representative of three independent experiments done in triplicate (mean ± SEM). Two-way ANOVA was used to assess significance. Significant differences are displayed for comparisons with the rIgG-treated group (***p < 0.001).
Figure 4
Figure 4
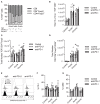
Impact of PD1/PD-L1 neutralization in the Tregs compartment. (A) Splenic percentage distribution of CD8 T cells (CD45+TCRβ+CD8α+), CD4 T cells (CD45+TCRβ+CD4+Foxp3), and Tregs (CD45+TCRβ+CD4+Foxp3+) is shown for TCRβ+ cells (CD45+TCRβ+). (B–D) Total number of CD8 T cells (B), conventional CD4 T cells (C), and Tregs (D) collected from the spleen after IL-2 stimulation. (E,F) Representative histograms (E) and total percentage (F) of PD-1 expression on gated Tregs. (G) Total percentage of CD69 is shown on gated Tregs. Data represent one or two experiments of a total of three independent experiments with 3–4 mice per group (mean ± SEM). Two-way ANOVA was used to assess significance. Significant differences are displayed for comparisons with the rIgG-treated group (*p < 0.05, **p < 0.01).
Figure 5
Figure 5
The activation status on CD8 T cells, but not on NK cells, is enhanced during IL-2 stimulation by the absence of Tregs. (A) The experimental regimen used to deplete Tregs on DTR-Foxp3 transgenic mice with diphtheria toxic (DT) treatment on acutely IL-2 stimulated mice. (B) Representative dot plots of CD25 and Foxp3 on TCRβ+CD4+ T cells after DT treatment after IL-2 stimulation. (C–E) Total number of Tregs (TCRβ+CD4+Foxp3+CD25+), NK cells (TCRβNK1.1+), and CD8 T cells (TCRβ+CD4CD8+) obtained from the spleen of treated mice. (F) Distribution of Eomes and T-bet is shown for gated NK (left panel) and CD8 T cells (right panel). (G) MFI expression of Eomes on gated Eomes+ NK cells after acute IL-2 stimulation. (H) The percentage of the activating population Eomes+T-bet+ on CD8 T cells is shown. (I,J) The total percentage of Ki67 for NK cells (I) and CD8 T cells (J) is shown. (K) The MFI of NKG2D gated on NKG2D+ CD8 T cells is shown. (L) The ability of IL-2-treated NK cells to respond to NK1.1 stimulation, assessed by IFNγ production, is shown. (M) GranB production by IL-2-treated CD8 T cells is shown. Data are representative of two independent experiments with three mice per group (mean ± SEM). Two-way ANOVA was used to assess significance (*p < 0.05, **p < 0.01, ***p < 0.001).
Figure 6
Figure 6
CD8 T cell activation phenotype is improved after anti-PD-L1 or anti-PD-1 treatment during chronic IL-2 stimulation. (A–C) Representative dot plots (A) and MFI (B,C) expression for Eomes and T-bet are shown on gated CD8 T cells (CD45+TCRβ+CD4CD8α+). (D) Total percentage of Eomes and T-bet-positive CD8 T cells is shown. (E) Proliferative potential of CD8 T cells assessed by Ki67 expression is shown. (F) Representative dot plots of Tim-3 and PD-1 are shown on gated CD8 T cells. (G) Total percentage of Tim-3PD1+ cells is shown on gated CD8 T cells. (H,I) Representative histograms (H) and total percentage (I) of NKG2D are shown for gated CD8 T cells. (J) Total percentage of CD25 is shown on gated CD8 T cells. (K,L) Representative histograms (K) and total (L) GranB production of CD8 T cells are shown. Data are representative of three independent experiments with 3–4 mice per group (mean ± SEM). Two-way ANOVA was used to assess significance. Significant differences are displayed for comparisons with the rIgG-treated group (*p < 0.05, **p < 0.01, ***p < 0.001).
Figure 7
Figure 7
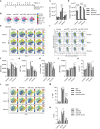
CD8 T cell depletion reverses the bystander effect of PD-1 blockade on NK cell activation during chronic IL-2 stimulation. (A) Regimen dose schedule followed for CD8 T cell depletion experiments. (B) t-SNE analysis is shown displaying the distribution of immune cell populations (ungated: blue; CD19Ly6GCD3CD4CD8NK1.1+ NK cells: yellow; CD19NK1.1CD3+CD4CD8 T cells: green; CD19NK1.1CD3+CD8 CD4 T cells: red; CD19CD3+CD8NK1.1+CD4+ NKT cells: purple; CD19CD3Ly6G+CD11b+MDSC: brown; and CD3NK1.1Ly6GCD19+ B cells: pink) after CD8 T cell depletion in unstimulated mice. (C,D) The total number of NK cells (C) and CD8 T cells (D) collected from the spleen after IL-2 stimulation is shown. (E) t-SNE analysis shows the Eomes expression of the different immune populations after IL-2 stimulation. (F,G) MFI expression of Eomes and the total percentage of the activating Eomes+T-bet+ NK cell population is shown on gated Eomes+ or T-bet+ NK cells (CD19Ly6GCD3CD4CD8NK1.1+). (H,I) NKG2D percentage (H) and MFI (I) are shown. (J) The total percentage of KLRG1 on gated NK cells is shown. (K) t-SNE analysis shows the Ki67 expression of the different immune populations after IL-2 stimulation. (L) The percentage of Ki67 is shown for gated NK cells. (M) The percentage of IFNγ is shown on gated NK cells after NK1.1 stimulation. Data are representative of two independent experiments with three mice per group (mean ± SEM). Two-way ANOVA was used to assess significance. Significant differences are displayed for comparisons with the PD-1-treated group (*p < 0.05, **p < 0.01, ***p < 0.001).

Similar articles

Cited by

References

    1. Simonetta F, Alvarez M, Negrin RS. Natural killer cells in graft-versus-host-disease after allogeneic hematopoietic cell transplantation. Front Immunol. (2017) 8:465. 10.3389/fimmu.2017.00465 - DOI - PMC - PubMed
    1. Pierini A, Alvarez M, Negrin RS. NK cell and CD4+FoxP3+ regulatory T Cell based therapies for hematopoietic stem cell engraftment. Stem Cells Int. (2016) 2016:9025835. 10.1155/2016/9025835 - DOI - PMC - PubMed
    1. Ruggeri L, Capanni M, Urbani E, Perruccio K, Shlomchik WD, Tosti A, et al. . Effectiveness of donor natural killer cell alloreactivity in mismatched hematopoietic transplants. Science. (2002) 295:2097–100. 10.1126/science.1068440 - DOI - PubMed
    1. Miller JS, Soignier Y, Panoskaltsis-Mortari A, McNearney SA, Yun GH, Fautsch SK, et al. . Successful adoptive transfer and in vivo expansion of human haploidentical NK cells in patients with cancer. Blood. (2005) 105:3051–7. 10.1182/blood-2004-07-2974 - DOI - PubMed
    1. Melero I, Rouzaut A, Motz GT, Coukos G. T-cell and NK-cell infiltration into solid tumors: a key limiting factor for efficacious cancer immunotherapy. Cancer Discov. (2014) 4:522–6. 10.1158/2159-8290.CD-13-0985 - DOI - PMC - PubMed

Publication types

MeSH terms