. 2020 Feb 12:11:54.
doi: 10.3389/fimmu.2020.00054. eCollection 2020.

The Immunomodulatory Properties of the Human Amnion-Derived Mesenchymal Stromal/Stem Cells Are Induced by INF-γ Produced by Activated Lymphomonocytes and Are Mediated by Cell-To-Cell Contact and Soluble Factors

Affiliations

The Immunomodulatory Properties of the Human Amnion-Derived Mesenchymal Stromal/Stem Cells Are Induced by INF-γ Produced by Activated Lymphomonocytes and Are Mediated by Cell-To-Cell Contact and Soluble Factors

Matteo Bulati et al. Front Immunol. .

Abstract

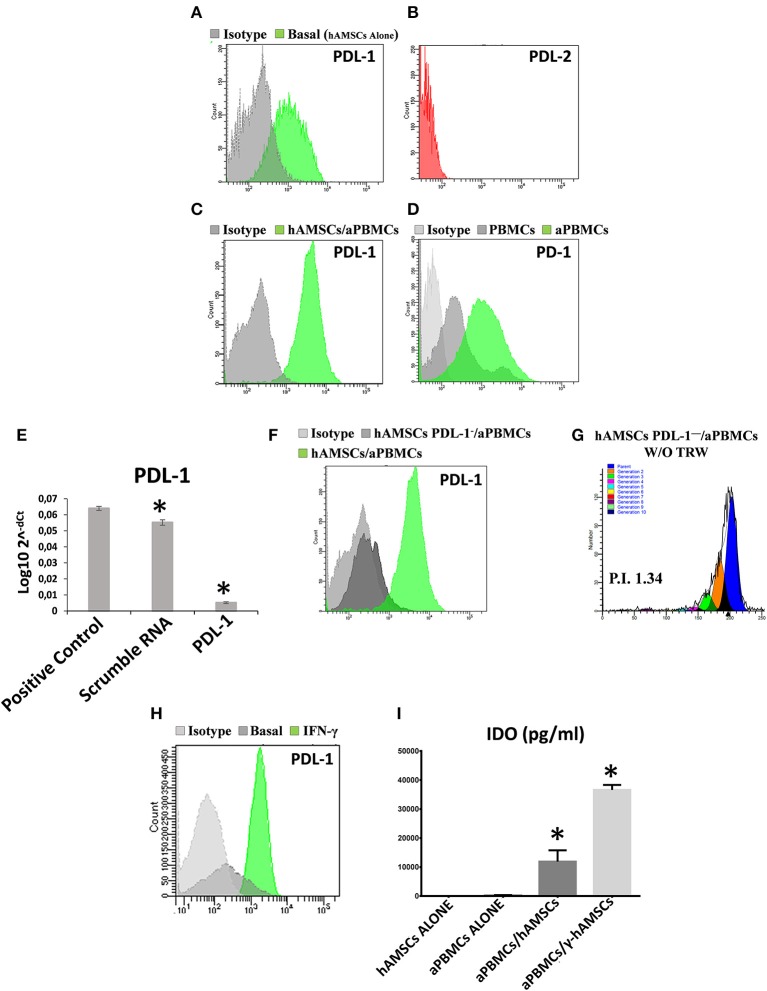
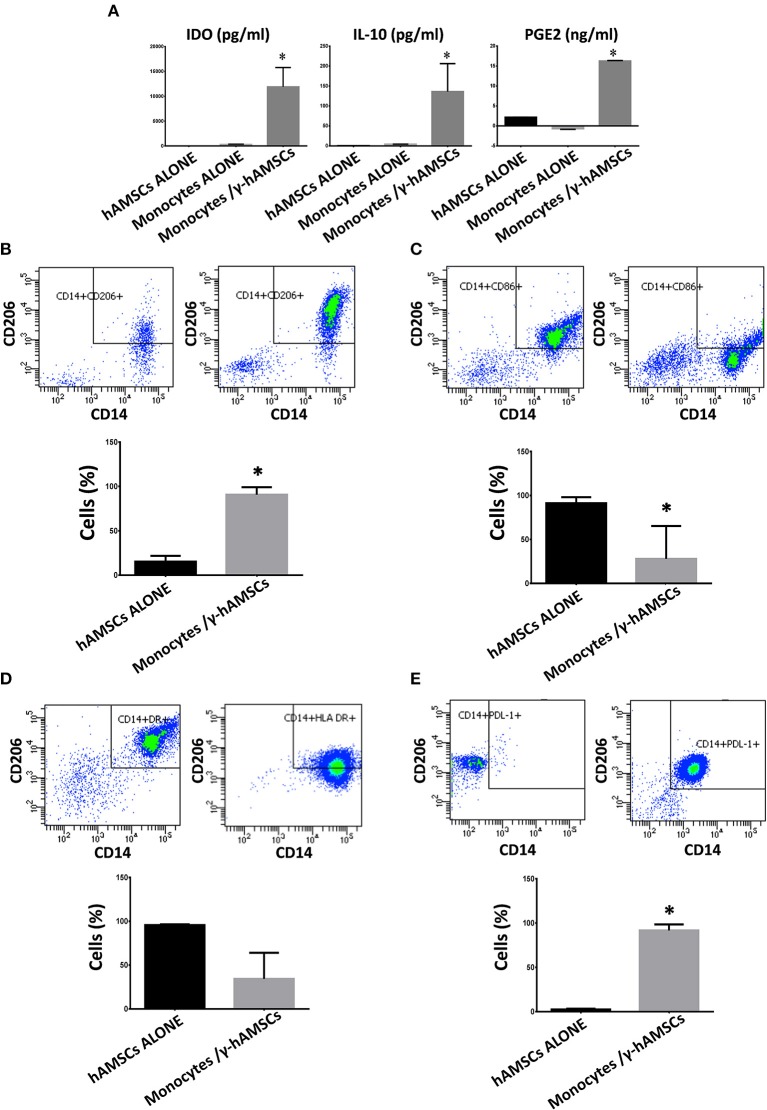
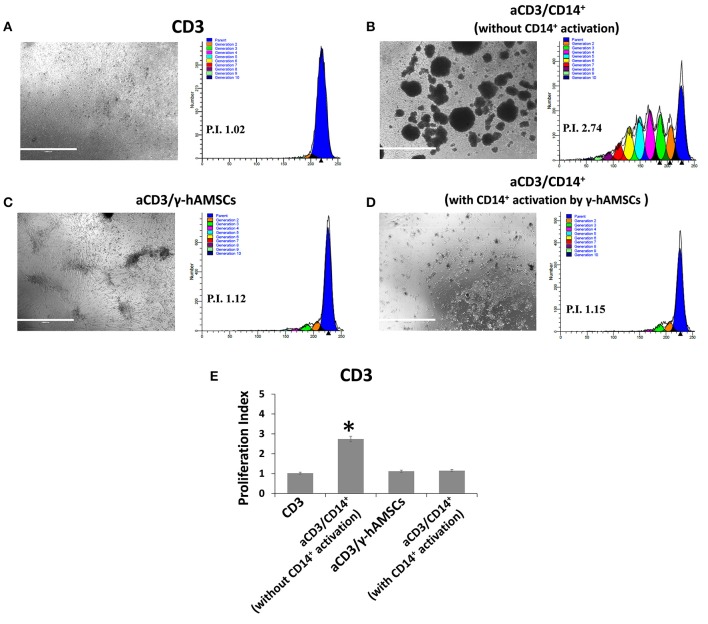
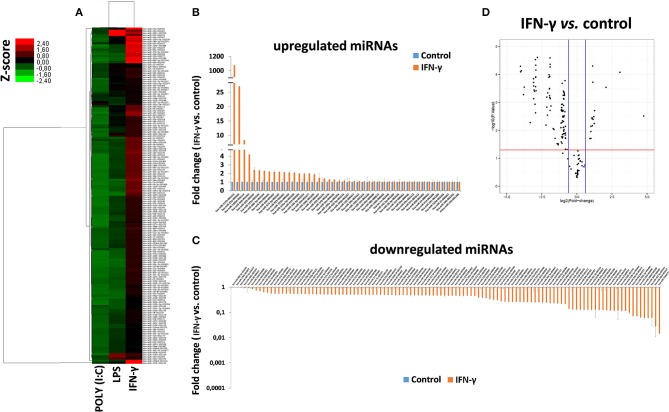
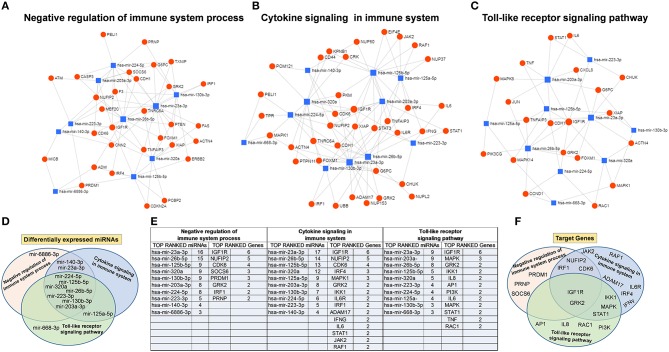
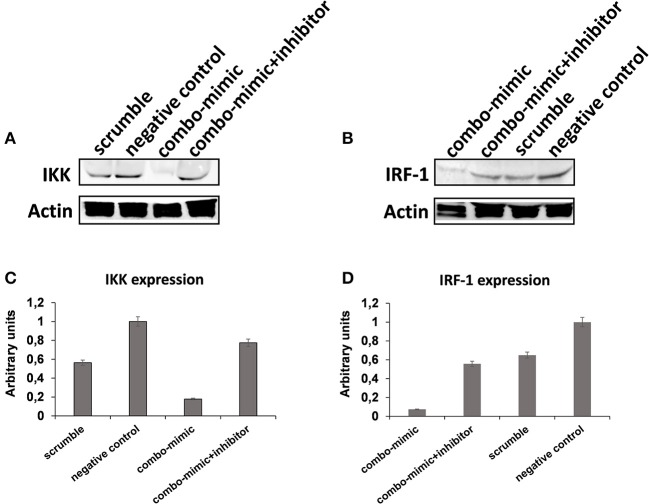
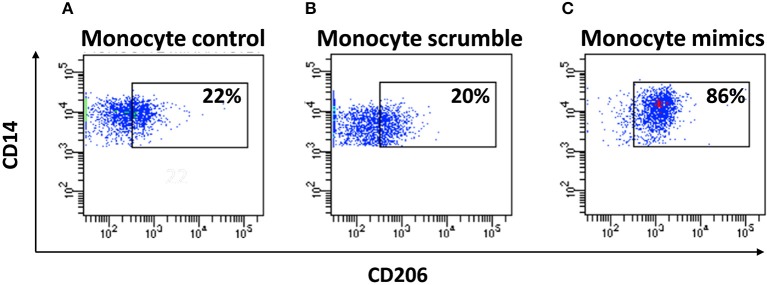
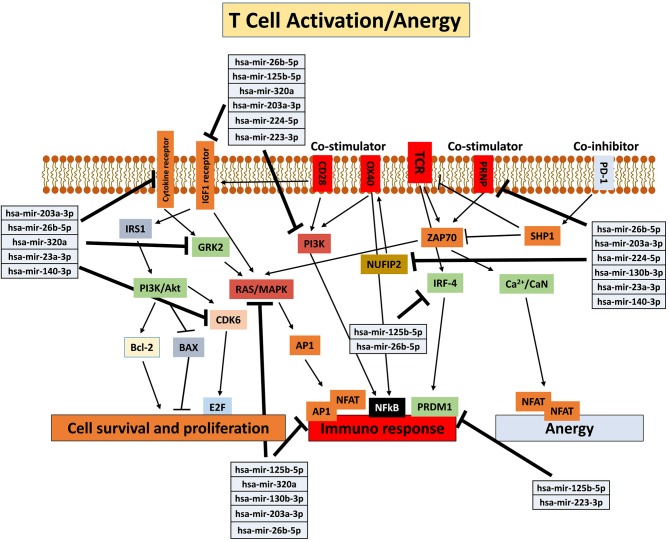
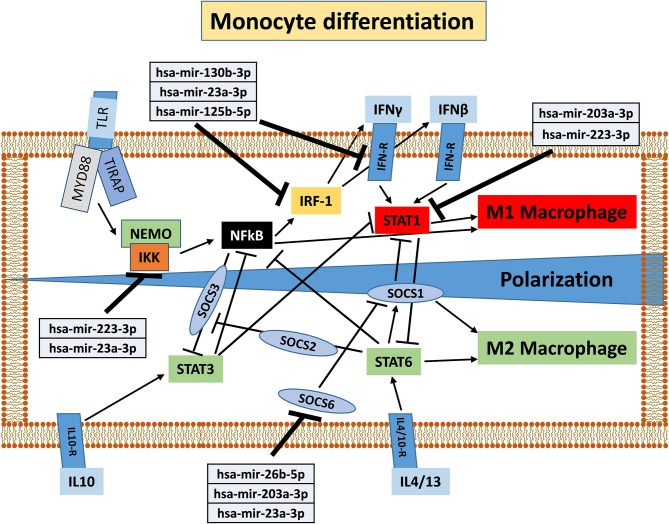
Human mesenchymal stromal/stem cells (MSCs), being immunoprivileged and having immunomodulatory ability, represent a promising tool to be applied in the field of regenerative medicine. Based on numerous in vitro evidences, the immunological effects of MSCs on immune cells could depend on different mechanisms as cell-to-cell contact and paracrine signals. Furthermore, recent studies have shown that the immunomodulatory activity of MSCs is initiated by activated immune cells; thus, their interaction represents a potential homeostatic mechanism by which MSCs regulate the immune response. MSCs also release exosomes able to give different effects, in a paracrine manner, by influencing inflammatory processes. In this study, we aimed to establish the potential role of human amnion-derived MSCs (hAMSCs), in immunomodulation. We found that the immunosuppressive properties of hAMSCs are not constitutive, but require "supportive signals" capable of promoting these properties. Indeed, we observed that hAMSCs alone are not able to produce an adequate amount of soluble immunomodulatory factors. Here, we studied, in depth, the strong immunomodulatory licensing signal deriving from the direct interaction between hAMSCs and stimulated peripheral blood mononuclear cells. We found that the immunomodulatory effect of hAMSCs also depends on cell-to-cell contact through the contribution of the PDL-1/PD-1 axis. We then investigated the IFN-γ priming of hAMSCs (γ-hAMSCs), which induce the increase of PDL-1 expression, high production of IDO, and upregulation of different immunomodulatory exosome-derived miRNAs. Our miRNA-target network analysis revealed that nine of the deregulated miRNAs are involved in the regulation of key proteins that control both T cell activation/anergy and monocyte differentiation pathways. Finally, we observed that γ-hAMSCs induce in monocytes both M2-like phenotype and the increase of IL-10 production. The extensive implications of MSCs in modulating different aspects of the immune system make these cells attractive candidates to be employed in therapeutic application in immune-based diseases. For these reasons, we aimed, with this study, to shed light on the potential of hAMSCs, and how they could become a useful tool for treating different inflammatory diseases, including end-stage pathologies or adverse effects in transplanted patients.

Keywords: M2-like monocytes; PDL-1; exosomes; human amnion-derived mesenchymal stem cells; immunomodulation; interferon-γ; primed-hAMSCs; regenerative medicine.


Figures

Figure 1
Figure 1
Characterization of EXO secreted by hAMSCs. (A) Size and concentration of EXO isolated from hAMSCs. (B) Size and intensity of EXO isolated from hAMSCs. (C) Representative images of EXO isolated from hAMSCs. (D) Size and concentration of EXO isolated from hAMSCs treated with IFNγ. (E) Size and intensity of EXO isolated from hAMSCs treated with IFNγ. (F) Representative images of EXO isolated from hAMSCs treated with IFNγ.
Figure 2
Figure 2
Expression analysis of immunomodulatory factors. Both protein (A,B) and gene (C,D) expression were assayed after 24 or 48 h of cultures in CM and cells, respectively. (A) Protein expression of immunomodulator factor in hAMSCs cultured for both 24 and 48 h. (B) Protein expression of immunomodulator factor in hAMSCs cultured for 48 h and treated with poly (I:C) or LPS. (C) Gene expression of immunomodulator factor in hAMSCs cultured for 24 h and treated with poly (I:C) or LPS. (D) Gene expression of immunomodulator factor in hAMSCs cultured for 48 h and treated with poly (I:C) or LPS. Transcript levels were normalized to those of GAPDH, and expressed as fold change vs. untreated cells (control). Data are means ± SD. *p < 0.05 vs. control.
Figure 3
Figure 3
Expression analysis of immunomodulatory factors in PBMCs/hAMSCs co-coltures. Protein expressions were assayed in CM after 5 days of culture. (A) IDO expression (pg/ml). (B) IL-10 expression (pg/ml). (C) PGE2 expression (ng/ml). (D) IL-6 expression (pg/ml). (E) IFNγ expression (pg/ml). (F) TNFα expression (pg/ml). (G) IP-10 expression (pg/ml). (H) MIG expression (pg/ml). (I) MIP-1α expression (pg/ml). (J) MIP-1β expression (pg/ml). Human amnion mesenchymal stem cells grown alone (hAMSCs ALONE); peripheral blood mononuclear cells grown alone (PBMCs ALONE); peripheral blood mononuclear cells grown alone, activated with anti-CD3, anti-CD28, anti-CD40, and anti-BCR (aPBMCs ALONE); peripheral blood mononuclear cells activated with anti-CD3, anti-CD28, anti-CD40, and anti-BCR grown in co-cultures with human amnion mesenchymal stem cells (aPBMCs/hAMSCs). Data are means ± SD. *p < 0.05 vs. aPBMCs/ALONE.
Figure 4
Figure 4
FACS analysis of PBMC proliferation co-cultured with hAMSCs. (A) Representative images and respective FACS graphic of unstimulated PBMCs grown alone (PBMCs). (B) Representative images and respective FACS graphic of PBMCs grown alone and activated with anti-CD3, anti-CD28, anti-CD40, and anti-BCR (aPBMCs). (C) Representative images and respective FACS graphic of hAMSCs co-cultured with PBMCs activated with anti-CD3, anti-CD28, anti-CD40, and anti-BCR, without Transwell (hAMSCs-aPBMCs W/O TRW). (D) Representative images and respective FACS graphic of hAMSCs co-cultured with PBMCs activated with anti-CD3, anti-CD28, anti-CD40, and anti-BCR, with Transwell (hAMSCs-aPBMCs W TRW). (E) Proliferation index of PBMCs. Data are means ± SD. *p < 0.05 vs. unstimulated PBMCs. P.I., proliferation index; bar = 1,000 μm.
Figure 5
Figure 5
Analysis of both PDL-1 and PD-1 expression in hAMSCs and PBMCs, analysis of PDL-1 in hAMSCs PDL-1 and IDO production analysis. (A) Representative FACS graphic of PDL-1 expression in hAMSCs grown alone (hAMSCs alone). (B) Representative FACS graphic of PDL-2 expression in hAMSCs grown alone. (C) Representative FACS graphic of PDL-1 expression in hAMSCs grown in co-cultures with PBMCs activated with anti-CD3, anti-CD28, anti-CD40, and anti-BCR (hAMSCs/aPBMCs). (D) Representative FACS graphic of PD-1 expression in PBMCs grown alone. (E) Expression of PDL-1 in hAMSCs after PDL-1 silencing. (F) Representative FACS graphic of PDL-1 expression in hAMSCs with or without CD274 silencing and in co-cultures with aPBMCs. (G) FACS graphic of aPBMCs proliferation co-cultured with hAMSCs PDL-1 without Transwell. (H) Representative FACS graphic of PDL-1 expression in hAMSCs activated with IFNγ. (I) IDO expression (pg/ml) in aPBMCs co-cultured with hAMSCs activated with IFNγ (γ-hAMSCs). Data are means ± SD. *p < 0.05 vs. positive control (E) or hAMSCs alone (I). P.I., proliferation index.
Figure 6
Figure 6
Expression analysis of immunomodulatory factors and phenotyping of monocytes co-cultured with hAMSCs activated with IFNγ (γ-hAMSCs). Protein expression was assayed in CM after 5 days of culture. (A) IDO, IL-10, and PGE2 expression in CM derived from monocytes/γ-hAMSC co-cultures. (B) FACS analysis of CD14+/CD206+ monocytes grown alone (left panel) or in co-cultures with γ-hAMSCs (right panel). (C) FACS analysis of CD14+/CD86+ monocytes grown alone (left panel) or in co-cultures with γ-hAMSCs (right panel). (D) FACS analysis of CD14+/HLA DR+ monocytes grown alone (left panel) or in co-cultures with γ-hAMSCs (right panel). (E) FACS analysis of CD14+/PDL-1+ monocytes grown alone (left panel) or in co-cultures with γ-hAMSCs (right panel). Data are means ± SD.
Figure 7
Figure 7
FACS analysis of CD3 cells proliferation co-cultured with CD14+ monocytes grown with or without γ-hAMSCs. (A) Representative images and respective FACS graphic of unstimulated CD3 cells grown alone (CD3). (B) Representative images and respective FACS graphic of CD3 cells stimulated with anti-CD3, anti-CD28, anti-CD40, and anti-BCR (aCD3) co-cultured with monocytes CD14+. (C) Representative images and respective FACS graphic of aCD3 co-cultured with hAMSCs activated with IFNγ (γ-hAMSCs). (D) Representative images and respective FACS graphic of aCD3 co-cultured with monocytes CD14+ pre-stimulated by co-cultures with γ-hAMSCs. (E) Proliferation index of CD3. Data are means ± SD. *p < 0.05 vs. unstimulated CD3. P.I., proliferation index; bar = 1,000 μm.
Figure 8
Figure 8
Differentially expressed miRNAs in EXO derived from hAMSCs. (A) Hierarchical clustering based on Z ratios (calculated as described in the Materials and Methods section) of miRNA expression levels in EXO derived from hAMSCs treated with poly (I:C), LPS, and IFNγ. (B) Upregulated miRNAs in EXO derived from hAMSCs treated with IFNγ. (C) Downregulated miRNAs in EXO derived from hAMSCs treated with IFNγ. (D) Volcano plot analysis of deregulated miRNAs in EXO derived from hAMSCs treated with IFNγ (p ≤ 0.05 and fold change ≥ 1.5). miRNA levels were normalized to those of U6, and expressed as fold change vs. untreated cells (control). Data are means ± SD.
Figure 9
Figure 9
Protein–protein interaction network generated for shared miRNA target genes after miRNET analysis. Only genes targeted by at least two differentially expressed miRNAs are shown. Upper images show networks with all interactions between deregulated miRNAs and genes involved in (A) negative regulation of immune system process, (B) cytokine signaling in immune system, and (C) toll-like receptor signaling pathway. (D) Distribution of the top-ranked deregulated miRNAs in the three analyzed pathways. (E) Table summarizing both the top-ranked miRNAs and the top-ranked genes showed in the network analysis. (F) Distribution of the top-ranked target genes in the three analyzed pathways.
Figure 10
Figure 10
Western blot analysis of IKK, IRF-1, and Actin protein in whole lysates of purified monocytes. (A) Western blot image of IKK and Actin protein. (B) Western blot image of IRF-1 and Actin protein. (C) IKK Western blot results quantified by ImageJ software. (D) IRF-1 Western blot results quantified by ImageJ software. Protein expression was normalized to β-Actin, and the ratio to relevant control was presented as fold changes (C,D). In the combo-mimic treatment for IKK, the cells were transfected with miR-223-3p and miR-23a-3p. In the combo-mimic treatment for IRF-1, the cells were transfected with miR-23a-3p, miR-130b-3p, and miR-125b-5p.
Figure 11
Figure 11
FACS analysis of purified miRNA-transfected monocytes. (A) FACS analysis of CD14+/CD206+ untransfected monocytes. (B) FACS analysis of CD14+/CD206+ monocytes transfected with scrumble. (C) FACS analysis of CD14+/CD206+ monocytes transfected with miR-130b-3p, miR-26b-5p, miR-125b-5p, miR-203a-3p, miR-23a-3p, and miR-223-3p.
Figure 12
Figure 12
Schematic representation of T cell activation/anergy pathways modified from KEGG PATHWAY Database (https://www.genome.jp/kegg/pathway.html). Deregulated miRNAs and corresponding genes target are shown.
Figure 13
Figure 13
Schematic representation of monocyte differentiation toward M1 or M2 phenotype modified from KEGG PATHWAY Database (https://www.genome.jp/kegg/pathway.html). Deregulated miRNAs and corresponding target genes are shown.

References

    1. Andreeva E, Bobyleva P, Gornostaeva A, Buravkova L. Interaction of multipotent mesenchymal stromal and immune cells: bidirectional effects. Cytotherapy. (2017) 19:1–66. 10.1016/j.jcyt.2017.07.001 - DOI - PubMed
    1. Gao F, Chiu SM, Motan DA, Zhang Z, Chen L, Ji HL, et al. . Mesenchymal stem cells and immunomodulation: current status and future prospects. Cell Death Dis. (2016) 7:e2062. 10.1038/cddis.2015.327 - DOI - PMC - PubMed
    1. Shi Y, Wang Y, Li Q, Liu K, Hou J, Shao C, et al. . Immunoregulatory mechanisms of mesenchymal stem and stromal cells in inflammatory diseases. Nat Rev Nephrol. (2018) 14:1–507. 10.1038/s41581-018-0023-5 - DOI - PubMed
    1. Parolini O, Alviano F, Bagnara GP, Bilic G, Buhring HJ, Evangelista M, et al. . Concise review: isolation and characterization of cells from human term placenta: outcome of the first international Workshop on Placenta Derived Stem Cells. Stem Cells. (2008) 26:1–11. 10.1634/stemcells.2007-0594 - DOI - PubMed
    1. Romanov YA, Svintsitskaya VA, Smirnov VN. Searching for alternative sources of postnatal human mesenchymal stem cells: candidate MSC-like cells from umbilical cord. Stem Cells. (2003) 21:1–10. 10.1634/stemcells.21-1-105 - DOI - PubMed

Publication types

MeSH terms