

Cell-Mediated Immune Responses to in vivo-Expressed and Stage-Specific Mycobacterium tuberculosis Antigens in Latent and Active Tuberculosis Across Different Age Groups
- PMID: 32117257
- PMCID: PMC7026259
- DOI: 10.3389/fimmu.2020.00103
Cell-Mediated Immune Responses to in vivo-Expressed and Stage-Specific Mycobacterium tuberculosis Antigens in Latent and Active Tuberculosis Across Different Age Groups
Abstract
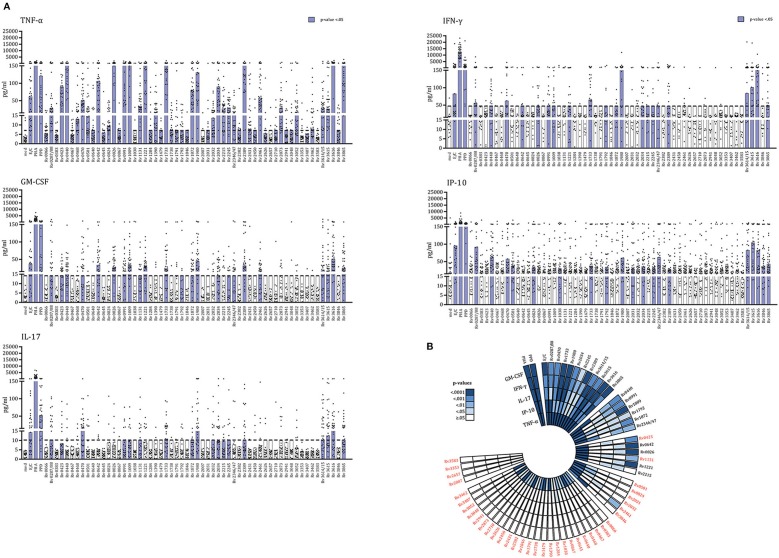
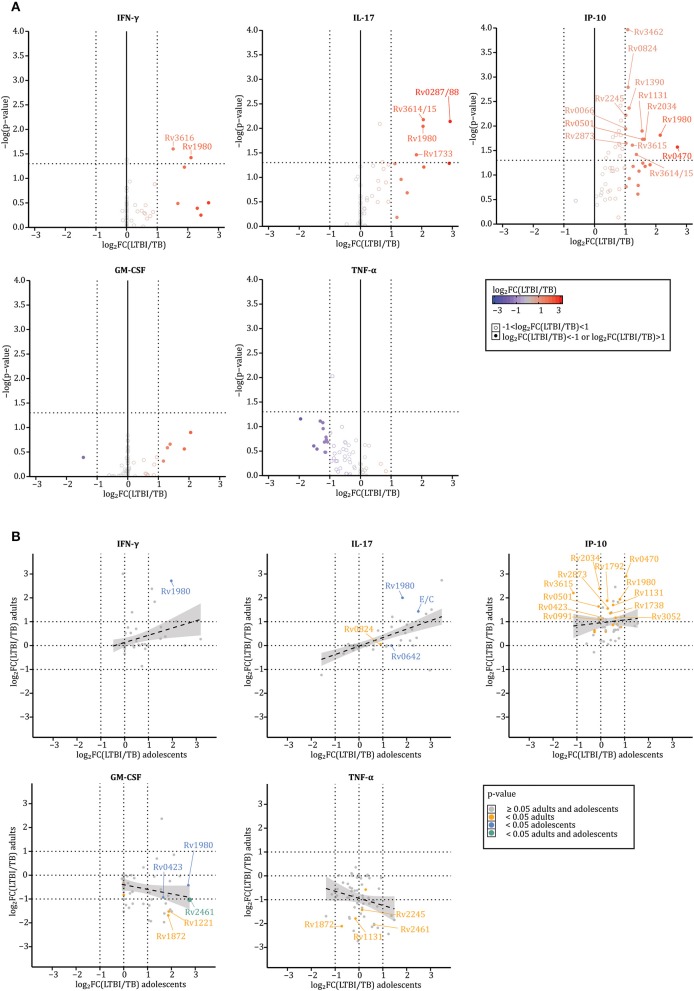
A quarter of the global human population is estimated to be latently infected by Mycobacterium tuberculosis (Mtb), the causative agent of tuberculosis (TB). TB remains the global leading cause of death by a single pathogen and ranks among the top-10 causes of overall global mortality. Current immunodiagnostic tests cannot discriminate between latent, active and past TB, nor predict progression of latent infection to active disease. The only registered TB vaccine, Bacillus Calmette-Guérin (BCG), does not adequately prevent pulmonary TB in adolescents and adults, thus permitting continued TB-transmission. Several Mtb proteins, mostly discovered through IFN-γ centered approaches, have been proposed as targets for new TB-diagnostic tests or -vaccines. Recently, however, we identified novel Mtb antigens capable of eliciting multiple cytokines, including antigens that did not induce IFN-γ but several other cytokines. These antigens had been selected based on high Mtb gene-expression in the lung in vivo, and have been termed in vivo expressed (IVE-TB) antigens. Here, we extend and validate our previous findings in an independent Southern European cohort, consisting of adults and adolescents with either LTBI or TB. Our results confirm that responses to IVE-TB antigens, and also DosR-regulon and Rpf stage-specific Mtb antigens are marked by multiple cytokines, including strong responses, such as for TNF-α, in the absence of detectable IFN-γ production. Except for TNF-α, the magnitude of those responses were significantly higher in LTBI subjects. Additional unbiased analyses of high dimensional flow-cytometry data revealed that TNF-α+ cells responding to Mtb antigens comprised 17 highly heterogeneous cell types. Among these 17 TNF-α+ cells clusters identified, those with CD8+TEMRA or CD8+CD4+ phenotypes, defined by the expression of multiple intracellular markers, were the most prominent in adult LTBI, while CD14+ TNF-α+ myeloid-like clusters were mostly abundant in adolescent LTBI. Our findings, although limited to a small cohort, stress the importance of assessing broader immune responses than IFN-γ alone in Mtb antigen discovery as well as the importance of screening individuals of different age groups. In addition, our results provide proof of concept showing how unbiased multidimensional multiparametric cell subset analysis can identify unanticipated blood cell subsets that could play a role in the immune response against Mtb.
Keywords: IVE-TB antigens; LTBI; Mycobacterium tuberculosis (Mtb); TB; cell responses; cytokines.
Copyright © 2020 Coppola, Villar-Hernández, van Meijgaarden, Latorre, Muriel Moreno, Garcia-Garcia, Franken, Prat, Stojanovic, De Souza Galvão, Millet, Sabriá, Sánchez-Montalva, Noguera-Julian, Geluk, Domínguez and Ottenhoff.
Figures

Similar articles
-
Double- and monofunctional CD4⁺ and CD8⁺ T-cell responses to Mycobacterium tuberculosis DosR antigens and peptides in long-term latently infected individuals.Eur J Immunol. 2011 Oct;41(10):2925-36. doi: 10.1002/eji.201141602. Epub 2011 Aug 30. Eur J Immunol. 2011. PMID: 21728172
-
Genome wide approaches discover novel Mycobacterium tuberculosis antigens as correlates of infection, disease, immunity and targets for vaccination.Semin Immunol. 2018 Oct;39:88-101. doi: 10.1016/j.smim.2018.07.001. Epub 2018 Jul 7. Semin Immunol. 2018. PMID: 30327124 Review.
-
T cell responses to DosR and Rpf proteins in actively and latently infected individuals from Colombia.Tuberculosis (Edinb). 2012 Mar;92(2):148-59. doi: 10.1016/j.tube.2011.12.005. Epub 2012 Jan 5. Tuberculosis (Edinb). 2012. PMID: 22226907
-
Rv2204c, Rv0753c and Rv0009 antigens specific T cell responses in latent and active TB - a flow cytometry-based analysis.Int J Med Microbiol. 2018 Mar;308(2):297-305. doi: 10.1016/j.ijmm.2017.12.001. Epub 2017 Dec 6. Int J Med Microbiol. 2018. PMID: 29325881
-
Immunogenic potential of latency associated antigens against Mycobacterium tuberculosis.Vaccine. 2014 Feb 3;32(6):712-6. doi: 10.1016/j.vaccine.2013.11.065. Epub 2013 Dec 2. Vaccine. 2014. PMID: 24300592 Review.
Cited by
-
Classical CD4 T cells as the cornerstone of antimycobacterial immunity.Immunol Rev. 2021 May;301(1):10-29. doi: 10.1111/imr.12963. Epub 2021 Mar 9. Immunol Rev. 2021. PMID: 33751597 Free PMC article. Review.
-
The Missing Link in Correlates of Protective Tuberculosis Immunity: Recognizing the Infected Cell.Front Immunol. 2022 Apr 12;13:869057. doi: 10.3389/fimmu.2022.869057. eCollection 2022. Front Immunol. 2022. PMID: 35493495 Free PMC article. Review.
-
Accelerating research and development of new vaccines against tuberculosis: a global roadmap.Lancet Infect Dis. 2022 Apr;22(4):e108-e120. doi: 10.1016/S1473-3099(21)00810-0. Epub 2022 Feb 28. Lancet Infect Dis. 2022. PMID: 35240041 Free PMC article. Review.
-
Investigating Mycobacterium tuberculosis sufR (rv1460) in vitro and ex vivo expression and immunogenicity.PLoS One. 2023 Jun 15;18(6):e0286965. doi: 10.1371/journal.pone.0286965. eCollection 2023. PLoS One. 2023. PMID: 37319185 Free PMC article.
-
Role of dormancy survival regulator and resuscitation-promoting factors antigens in differentiating between active and latent tuberculosis: a systematic review and meta-analysis.BMC Pulm Med. 2024 Oct 29;24(1):541. doi: 10.1186/s12890-024-03348-4. BMC Pulm Med. 2024. PMID: 39472851 Free PMC article.
References
-
- World Health Organization Global Tuberculosis Report 2019 (2019).
-
- Geluk A, van Meijgaarden KE, Franken KL, Subronto YW, Wieles B, Arend SM, et al. . Identification and characterization of the ESAT-6 homologue of Mycobacterium leprae and T-cell cross-reactivity with Mycobacterium tuberculosis. Infect Immun. (2002) 70:2544–8. 10.1128/IAI.70.5.2544-2548.2002 - DOI - PMC - PubMed
Publication types
MeSH terms
Substances
LinkOut - more resources
Full Text Sources
Research Materials
Miscellaneous