

Modeling Flood-Induced Stress in Soybeans
- PMID: 32117398
- PMCID: PMC7028700
- DOI: 10.3389/fpls.2020.00062
Modeling Flood-Induced Stress in Soybeans
Abstract
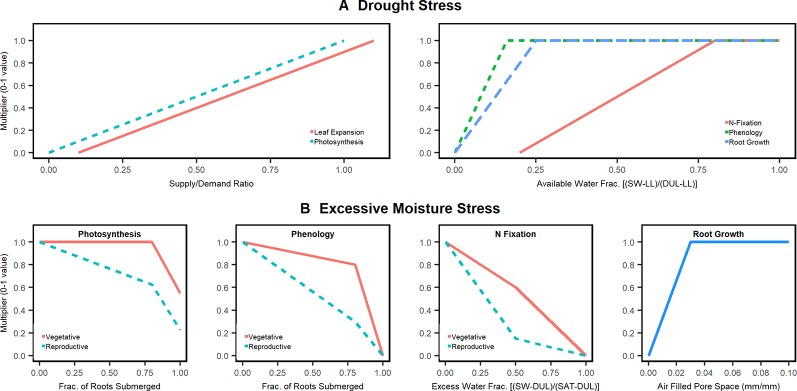
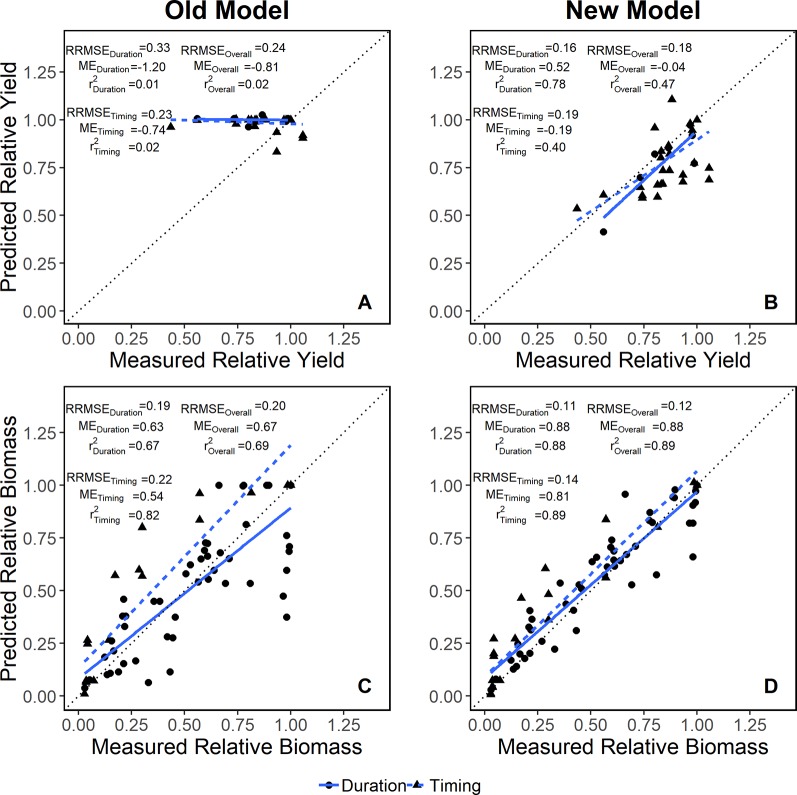
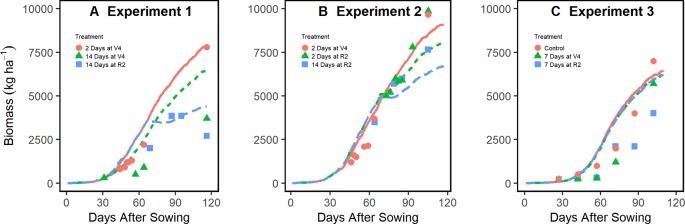
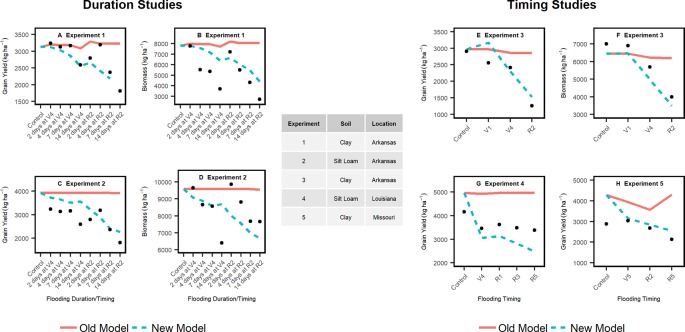
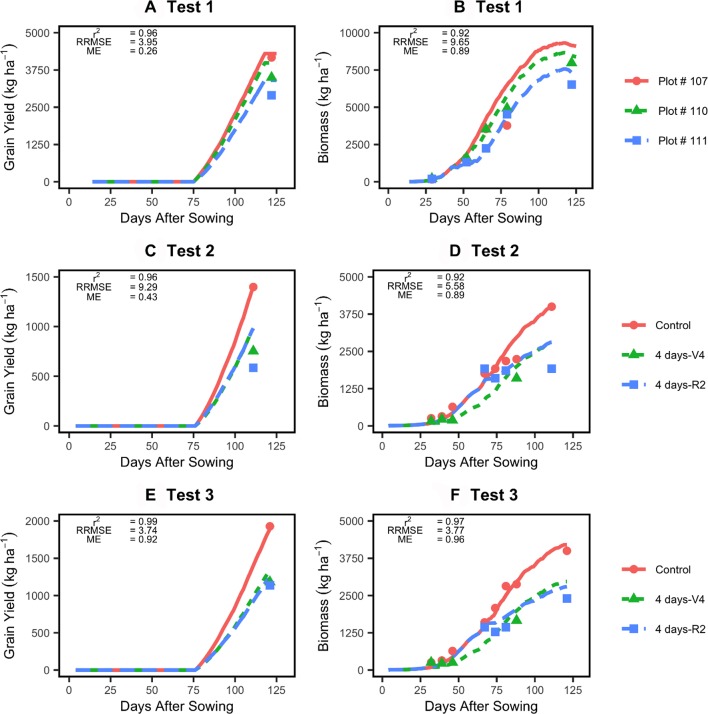
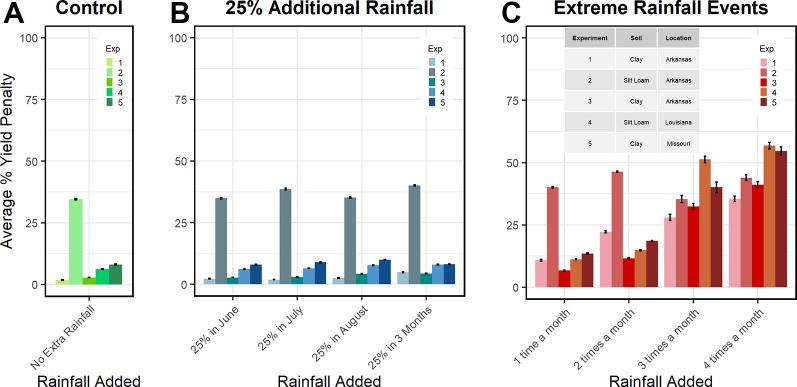
Despite the detrimental impact that excess moisture can have on soybean (Glycine max [L.] Merr) yields, most of today's crop models do not capture soybean's dynamic responses to waterlogged conditions. In light of this, we synthesized literature data and used the APSIM software to enhance the modeling capacity to simulate plant growth, development, and N fixation response to flooding. Literature data included greenhouse and field experiments from across the U.S. that investigated the impact of flood timing and duration on soybean. Five datasets were used for model parameterization of new functions and three datasets were used for testing. Improvements in prediction accuracy were quantified by comparing model performance before and after the implementation of new stage-dependent excess water functions for phenology, photosynthesis and N-fixation. The relative root mean square error (RRMSE) for yield predictions improved by 26% and the RRMSE predictions of biomass improved by 40%. Extensive model testing found that the improved model accurately simulates plant responses to flooding including how these responses change with flood timing and duration. When used to project soybean response to future climate scenarios, the model showed that intense rain events had a greater negative effect on yield than a 25% increase in rainfall distributed over 1 or 3 month(s). These developments advance our ability to understand, predict and, thereby, mitigate yield loss as increases in climatic volatility lead to more frequent and intense flooding events in the future.
Keywords: APSIM; climate change; excess water; flooding; modeling; soybean.
Copyright © 2020 Pasley, Huber, Castellano and Archontoulis.
Figures
References
-
- Archontoulis S. V., Miguez F. E. (2015). Nonlinear regression models and applications in agricultural research. Agron. J. 107, 2. 10.2134/agronj2012.0506 - DOI
-
- Archontoulis S. V., Miguez F. E., Moore K. J. (2014). A methodology and an optimization tool to calibrate phenology of short-day species included in the APSIM PLANT model: application to soybean. Environ. Modell. Software 62, 465–477. 10.1016/j.envsoft.2014.04.009 - DOI
-
- Archontoulis S. V., Castellano M. J., Licht M., Nichols V., Baum M., Huber I., et al. (2020). Predicting crop yields and soil-plant nitrogen dynamics in the US Corn Belt. Crop Sci. Accepted December 10, 2019, not yet in print. 10.1002/csc2.20039 - DOI
-
- Asseng S., Ewert F., Rosenzweig C., Jones J. W., Hatfield J. L., Ruane A. C., et al. (2013). Uncertainty in simulating wheat yields under climate change. Nat. Clim. Change 3, 827–832. 10.1038/nclimate1916 - DOI
LinkOut - more resources
Full Text Sources