. 2020 Feb 6:11:43.
doi: 10.3389/fgene.2020.00043. eCollection 2020.

H3K9 Demethylation-Induced R-Loop Accumulation Is Linked to Disorganized Nucleoli

Affiliations

H3K9 Demethylation-Induced R-Loop Accumulation Is Linked to Disorganized Nucleoli

Hong Zhou et al. Front Genet. .

Abstract

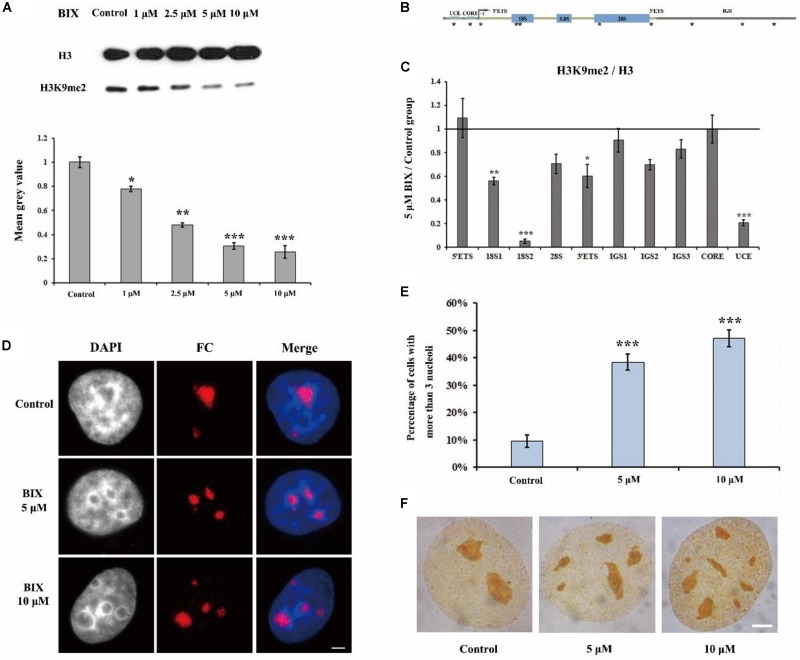
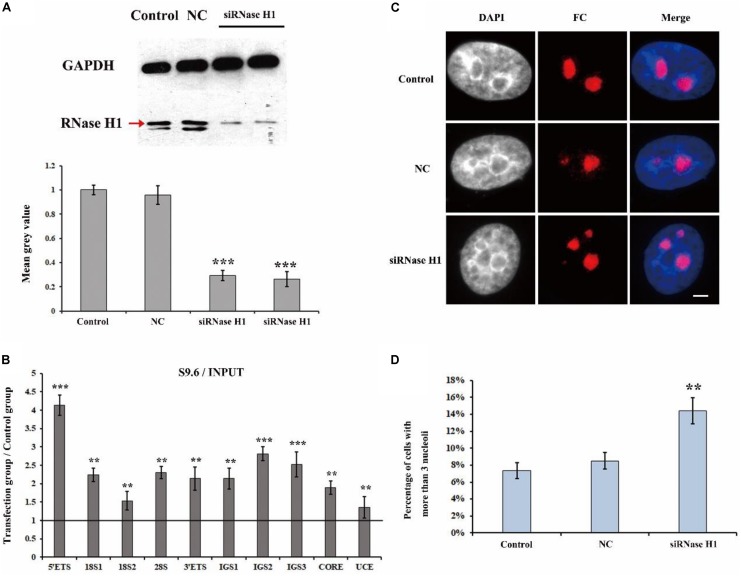
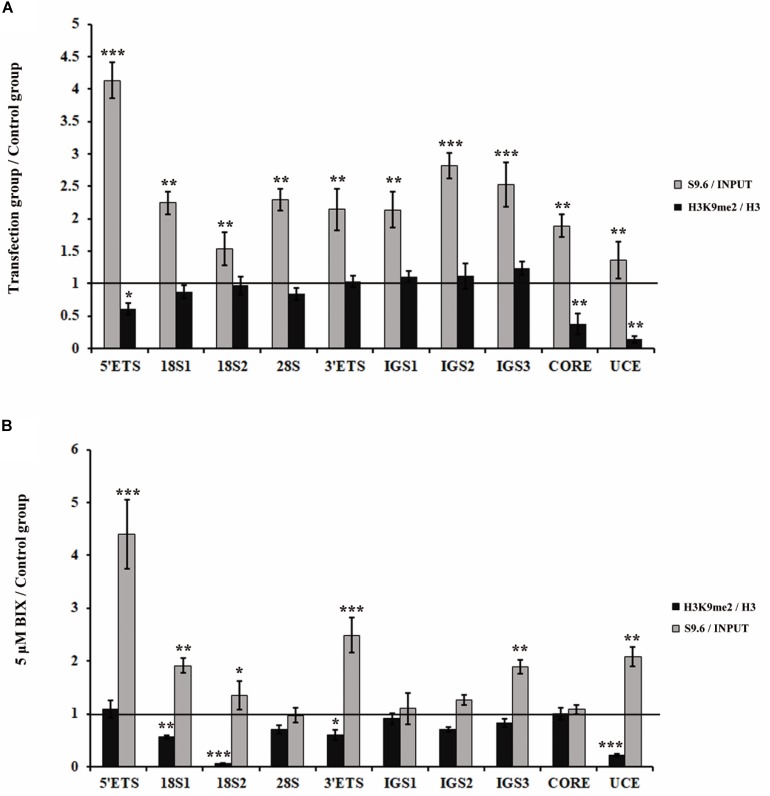
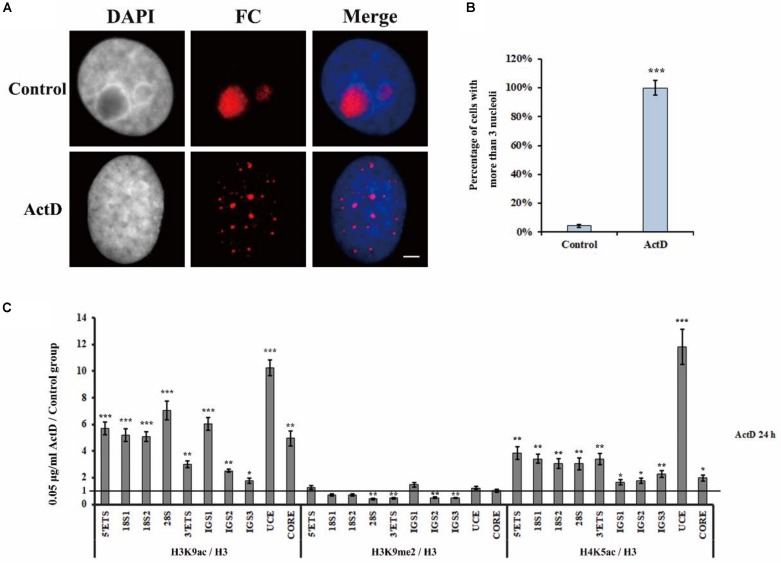
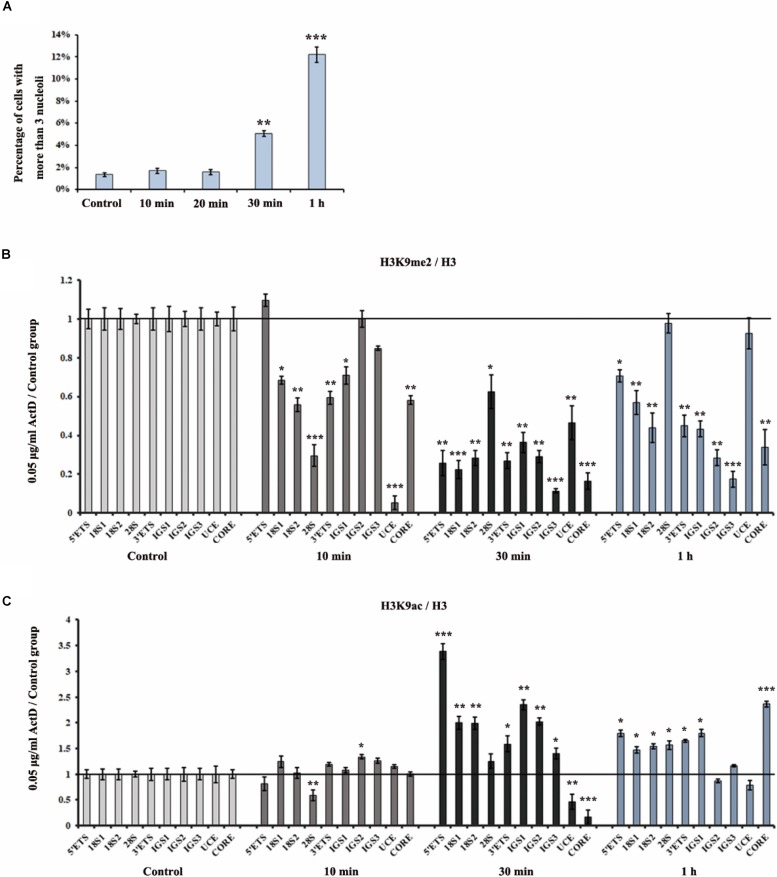
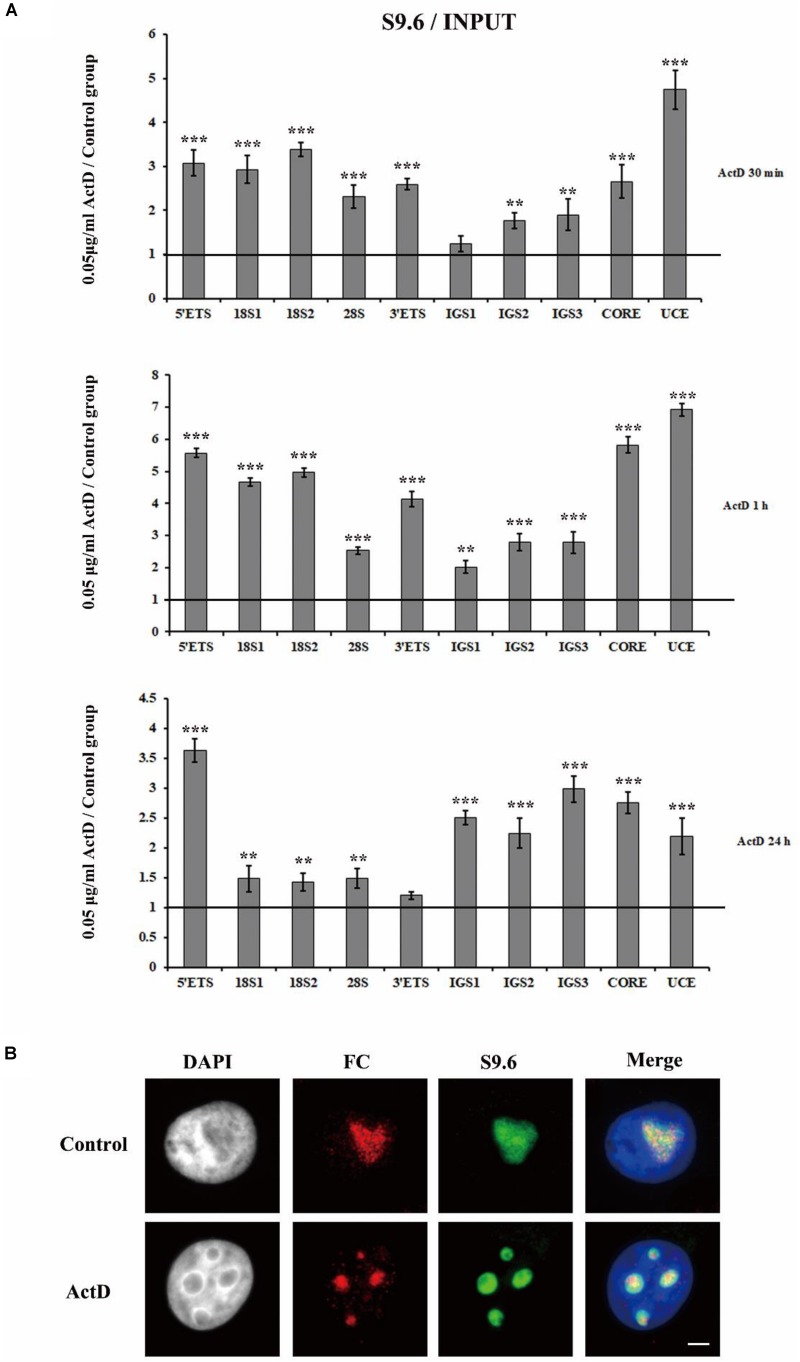
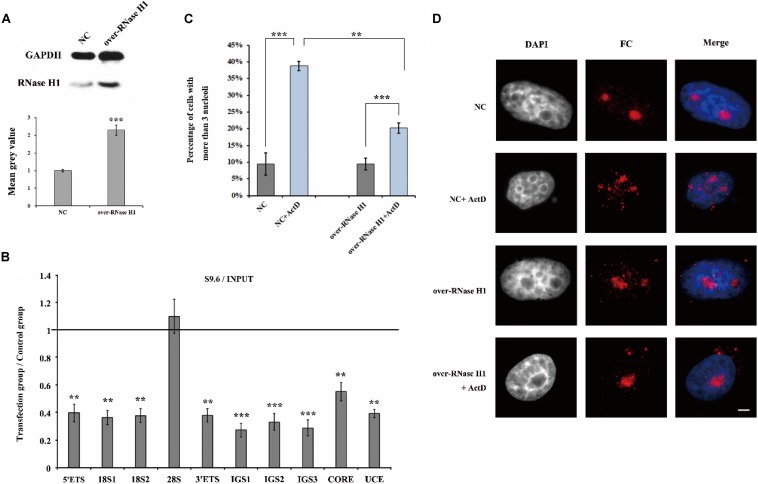
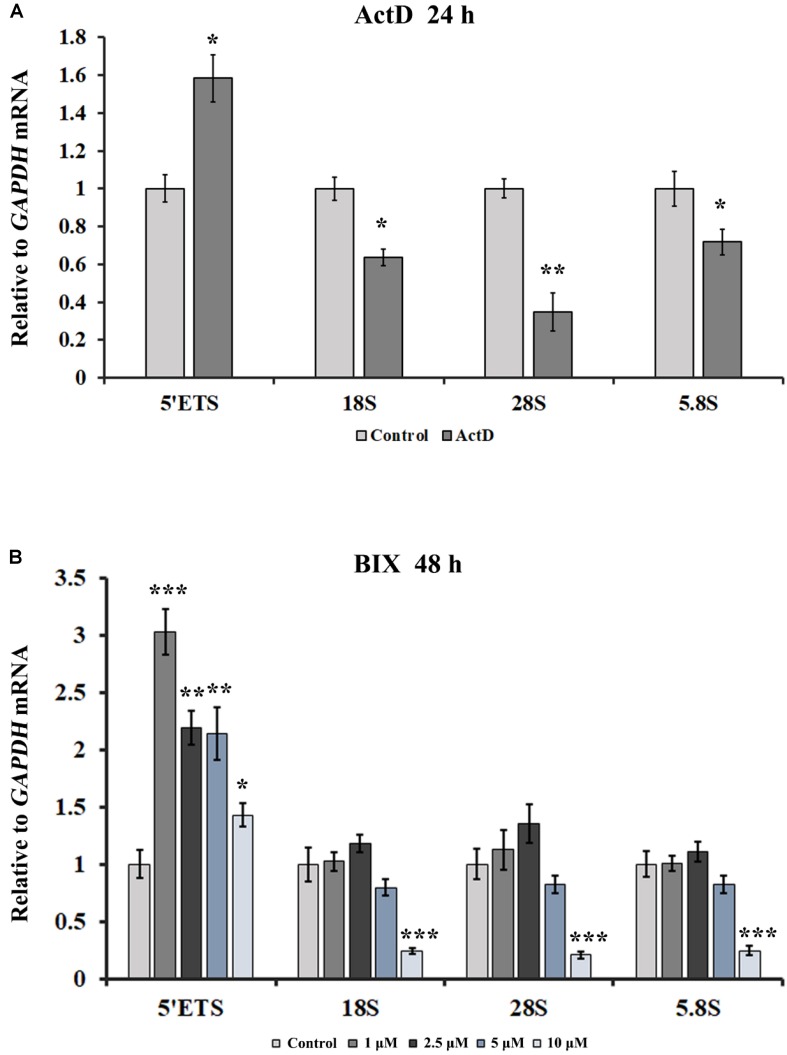
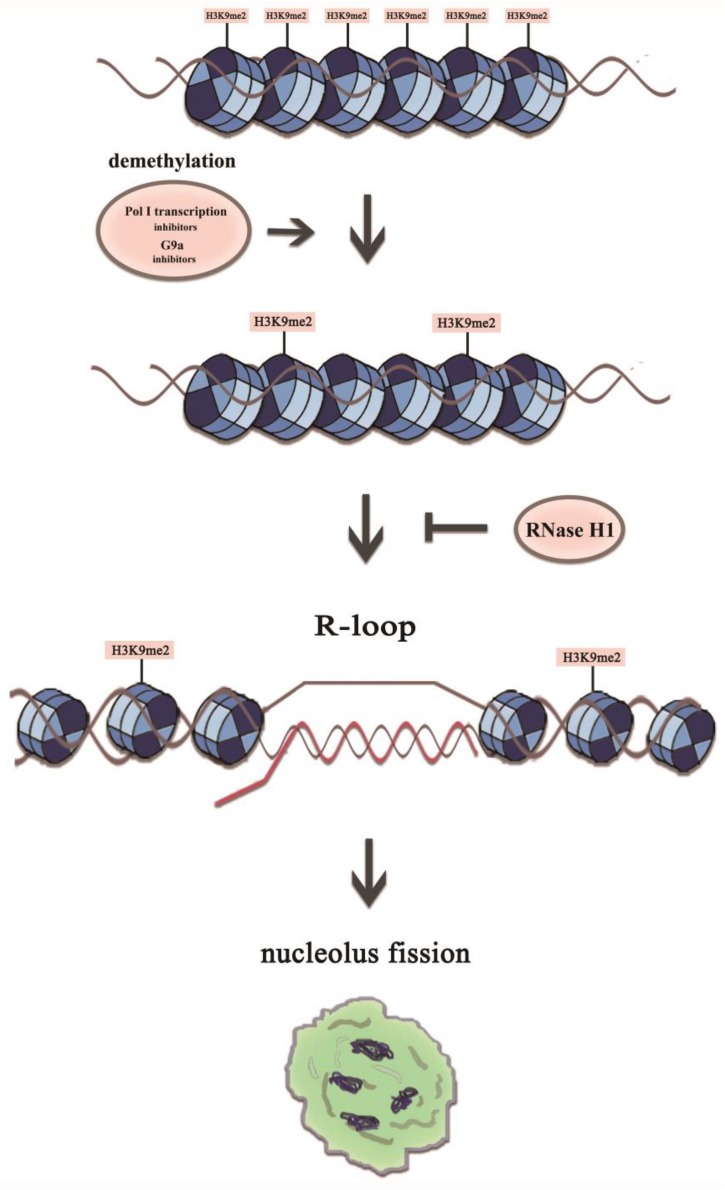
The nucleolar structure and integrity are important for a range of cellular functions of the nucleoli. It has been shown that cells lacking histone H3 Lysine 9 (H3K9) methylation form fragmented nucleoli. However, the molecular mechanism involved remains poorly understood. Here, we present evidence suggesting that loss of H3K9 dimethylation (H3K9me2) triggers R-loop accumulation at the rDNA locus, which further leads to the multilobed nucleoli. We reveal that suppression of H3K9 methyltransferase G9a by the inhibitor BIX 01294 causes R-loop accumulation at the rDNA region as well as inducing formation of multiple nucleoli. SiRNA-mediated knockdown of RNase H1 which can hydrolyze the RNA chain in R-loops causes an increase in R-loop formation, which in turn results in multiple nucleoli in one nucleus, whereas H3K9me2 levels are not affected by R-loop accumulation. Inhibition of RNA polymerase I transcription elongation by small molecule inhibitors induces a substantial decrease in H3K9me2 levels, accumulation of R-loops at rDNA sites, and nucleolus fragmentation. These results provide a mechanistic insight into the role of H3K9me2 in the structural integrity and organization of nucleoli via regulating R-loop accumulation.

Keywords: H3K9 dimethylation; R-loops; multiple nucleoli; ribosomal DNA; transcription inhibition.


Figures

FIGURE 1
FIGURE 1
The effect of G9a inhibitor BIX on nucleoli of HeLa cells. (A) Western blot analysis of H3K9me2 in HeLa cells after treatment with BIX for 48 h. (B) Schematic representation of the human rRNA genes and the positions of analyzed amplicons. (C) ChIP analysis of H3K9me2 levels at the rDNA regions in HeLa cells after treatment with or without BIX for 48 h. The y-axis indicates the ratio of the relative quantities of rDNA in the experimental group HeLa cells to the relative quantities of rDNA in control group HeLa cells. The x-axis indicates different regions of rDNA amplicons. Relative values were normalized to those of the total H3. (D) HeLa cells were incubated with or without 5 μM or 10 μM BIX for 48 h and then indirect immunofluorescence staining with the anti-fibrillarin antibody was used to detect the nucleoli. Scale bar = 3 μm. (E) Percentages of interphase nuclei with over three fragmented nucleoli after treatment with or without 5 μM or 10 μM BIX for 48 h, respectively. The number of evaluated nuclei in each group was 300. (F) Ag-NOR staining was used to detect the nucleolar structure in HeLa cells after treatment with or without BIX for 48 h. Scale bar = 3 μm. Data are expressed as *P < 0.05, **P < 0.01, and ***P < 0.001, measured by the t-test.
FIGURE 2
FIGURE 2
The effect of knockdown of RNase H1 on the R-loops and nucleoli of HeLa cells. (A) Western blot was used to detect the efficiency of the knockdown of RNase H1. (B) ChIP analysis of R-loops at the rDNA regions in HeLa cells after transfection with RNase H1 short-interfering RNA (siRNase H1) for 48 h. The y-axis indicates the ratio of the relative quantities of rDNA in the experimental group HeLa cells to the relative quantities of rDNA in control group HeLa cells. The x-axis indicates different regions of rDNA amplicons. Relative values were normalized to the input. Each experiment was repeated three times, and the average value and SD are shown. (C) HeLa cells were transfected with negative control siRNA (NC) or siRNase H1 for 48 h and then indirect immunofluorescence staining with the anti-fibrillarin antibody was used to detect the nucleoli. Scale bar = 3 μm. (D) Percentages of interphase nuclei with more than three fragmented nucleoli after transfection with siRNase H1 for 48 h. The number of evaluated nuclei in each group was 300. Data are expressed as *P < 0.05, **P < 0.01, and ***P < 0.001, measured by the t-test.
FIGURE 3
FIGURE 3
Analysis of the relationship between H3K9me2 and R-loops at rDNA sites in HeLa cells. (A) ChIP analysis showed the level of histone H3K9me2 and R-loops at the rDNA regions after transfection with siRNase H1 for 48 h. The y-axis indicates the ratio of the relative quantities of rDNA in the experimental group HeLa cells to the relative quantities of rDNA in control group HeLa cells. The x-axis indicates different regions of rDNA amplicons. Relative values of H3K9me2 were normalized to those of the total H3 and relative values of R-loops were normalized to the input. Each experiment was repeated three times, and the average value and SD are shown. (B) ChIP analysis of R-loops and the levels of H3K9me2 at the rDNA regions in HeLa cells after treatment with or without BIX for 48 h. Each experiment was repeated three times, and the average value and SD are shown. Data are expressed as *P < 0.05, **P < 0.01, and ***P < 0.001, measured by the t-test.
FIGURE 4
FIGURE 4
The changes of epigenetic modifications in rDNA site of HeLa cells after treatment with ActD. (A) HeLa cells were treated with or without ActD for 24 h and then indirect immunofluorescence staining with the anti-fibrillarin antibody was used to detect the nucleoli. Scale bar = 3 μm. (B) Percentages of interphase nuclei with over three fragmented nucleoli after treatment with or without ActD. The number of evaluated nuclei in each group was 300. (C) ChIP analysis of levels of H3K9ac, H3K9me2, and H4K5ac at the rDNA regions in HeLa cells after treatment with or without ActD. The y-axis indicates the ratio of the relative quantities of rDNA in the experimental group HeLa cells to the relative quantities of rDNA in control group HeLa cells. The x-axis indicates different regions of rDNA amplicons. Relative values were normalized to those of the total H3. Each experiment was repeated three times and the average values are shown with the SD. Data are expressed as *P < 0.05, ***P < 0.05, **P < 0.01, and ***P < 0.001, measured by the t-test.
FIGURE 5
FIGURE 5
Analysis of disorganized nucleoli and histone modifications at rDNA regions in HeLa cells after treatment with ActD at different time points. (A) Percentages of interphase nuclei with over three fragmented nucleoli after treatment without or with ActD at different time points. The number of evaluated nuclei in each group was 300. (B) ChIP analysis of the level of H3K9me2 at the rDNA regions in HeLa cells after treatment with or without ActD at different time points. The y-axis indicates the ratio of the relative quantities of rDNA in the experimental group HeLa cells to the relative quantities of rDNA in control group HeLa cells. The x-axis indicates different regions of rDNA amplicons. (C) ChIP analysis of the level of H3K9ac at the rDNA regions in HeLa cells after treatment without or with ActD at different time points. Relative values were normalized to those of the total H3. Each experiment was repeated three times and the average values are shown with the SD. Data are expressed as *P < 0.05, **P < 0.01, and ***P < 0.001, measured by the t-test.
FIGURE 6
FIGURE 6
The accumulation and localization of R-loops in HeLa cells after treatment with Pol I transcription inhibitors. (A) ChIP analysis of R-loops at the rDNA regions in HeLa cells after treatment with ActD for 0.5 h, 1 h, and 24 h. The y-axis indicates the ratio of the relative quantities of rDNA in the experimental group HeLa cells to the relative quantities of rDNA in control group HeLa cells. The x-axis indicates different regions of rDNA amplicons. Relative values were normalized to the input. Each experiment was repeated three times and the average values are shown with the SD. (B) Nucleoli and R-loops were detected by indirect immunofluorescence staining with an antibody against fibrillarin (FC, red) and an antibody against R-loop (S9.6, green) in interphase nuclei of ActD-treated Hela cells at 1 h. Data are expressed as *P < 0.05, **P < 0.01, and ***P < 0.001, measured by the t-test.
FIGURE 7
FIGURE 7
The effect of overexpression of RNase H1 on ActD-induced nucleolar fragmentation in HeLa cells. (A) Western blot was used to detect the efficiency of the RNase H1 overexpression plasmid. NC represents samples transfected with empty plasmids. Over-RNase H1 represents samples transfected with pcDNA3.0-RNase H1. (B) ChIP analysis of R-loops at the rDNA regions in HeLa cells after transfection with RNase H1 overexpression plasmid. The y-axis indicates the ratio of the relative quantities of rDNA in the experimental group HeLa cells to the relative quantities of rDNA in control group HeLa cells. The x-axis indicates different regions of rDNA amplicons. Relative values were normalized to the input. Each experiment was repeated three times and the average values are shown with the SD. (C) Percentages of interphase nuclei with more than three fragmented nucleoli after treatment with or without ActD for 24 h. Number of evaluated nuclei in each group was 300. (D) Nucleoli were detected by indirect immunofluorescence staining with an antibody against fibrillarin. Scale bar = 3 μm. Each experiment was repeated three times and the average values are shown with the SD. Data are expressed as *P < 0.05, **P < 0.01, and ***P < 0.001, measured by the t-test.
FIGURE 8
FIGURE 8
The effects of ActD and BIX treatment on rDNA transcription initiation. (A) qRT-PCR was used to detect the incomplete 5′ETS transcripts and the mature rRNA expressions in HeLa cells after treatment with ActD for 24 h. (B) qRT-PCR was used to detect the incomplete 5′ETS transcripts and the mature rRNA expressions in HeLa cells after treatment with BIX for 48 h. Expression values were normalized to the gene GAPDH. The relative expression ratio of each sample was compared with untreated cells, the expression value of which were assigned as 1. Each experiment was repeated three times, and the average value and SD are shown. Data are expressed as *P < 0.05, **P < 0.01, and ***P < 0.001, measured by the t-test.
FIGURE 9
FIGURE 9
A model representing mechanistic link between H3K9me2 and nucleolus fission via the accumulation of R-loops at the rDNA regions. The transient R-loop formed in the transcriptional process is hydrolyzed by RNase H1, leading to complementation of template strand DNA and antisense strand. However, in the presence of RNA polymerase I transcription inhibitors or the epigenetic inhibitor BIX, the level of H3K9me2 decreases significantly, which leads to the augmentation of rDNA transcription initiation and R-loop accumulation, resulting in a structurally disorganized nucleolus.

References

    1. Aguilera A., Garcã-A-Muse T. (2012). R loops: from transcription byproducts to threats to genome stability. Mol. Cell 46 115–124. 10.1016/j.molcel.2012.04.009 - DOI - PubMed
    1. Amon J. D., Koshland D. (2016). RNase H enables efficient repair of R-loop induced DNA damage. Elife 5:e20533. 10.7554/eLife.20533 - DOI - PMC - PubMed
    1. Andersen J. S., Yun W. L., Leung A. K. L., Ong S. E., Lyon C. E., Lamond A. I., et al. (2005). Nucleolar proteome dynamics. Nature 433 77–83. 10.1038/nature03207 - DOI - PubMed
    1. Berger S. L. (2007). The complex language of chromatin regulation during transcription. Nature 447 407–412. 10.1038/nature05915 - DOI - PubMed
    1. Buck S. W., Sandmeier J. J., Smith J. S. (2002). RNA polymerase I propagates unidirectional spreading of rDNA silent chromatin. Cell 111 1003–1014. 10.1016/s0092-8674(02)01193-5 - DOI - PubMed

LinkOut - more resources