. 2020 Feb 17;9(1):1724763.
doi: 10.1080/2162402X.2020.1724763. eCollection 2020.

Helper T cell-dominant tertiary lymphoid structures are associated with disease relapse of advanced colorectal cancer

Affiliations

Helper T cell-dominant tertiary lymphoid structures are associated with disease relapse of advanced colorectal cancer

Kyoko Yamaguchi et al. Oncoimmunology. .

Abstract

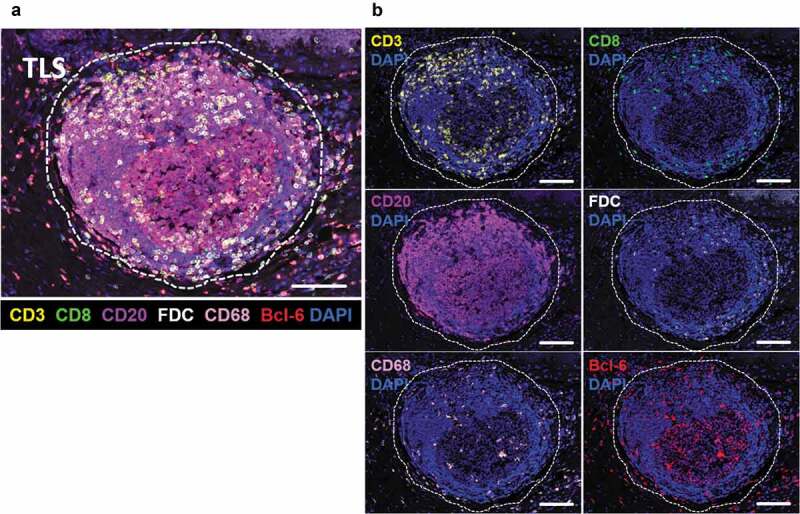
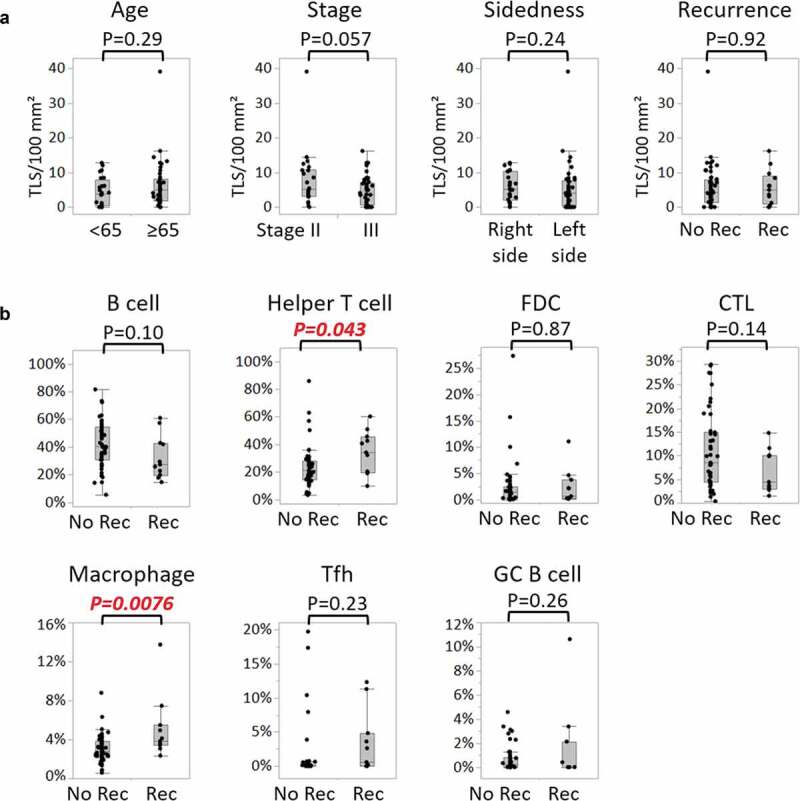
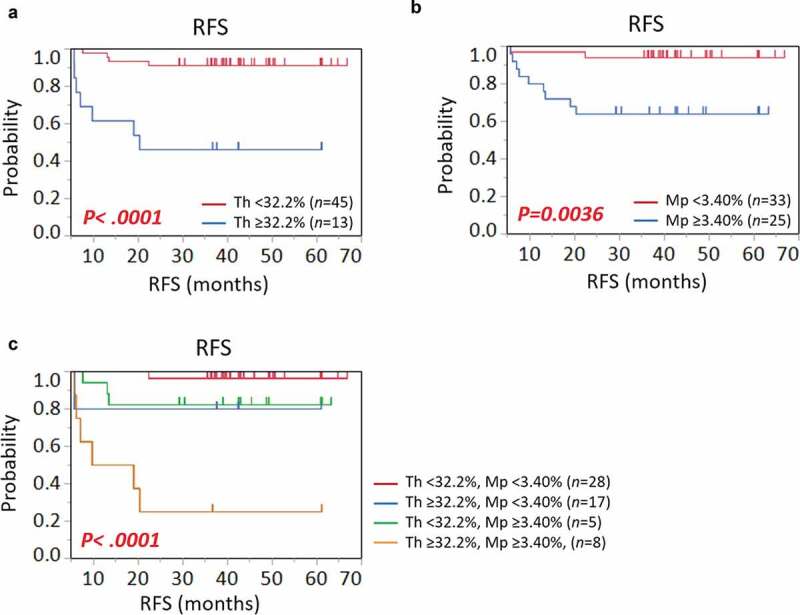
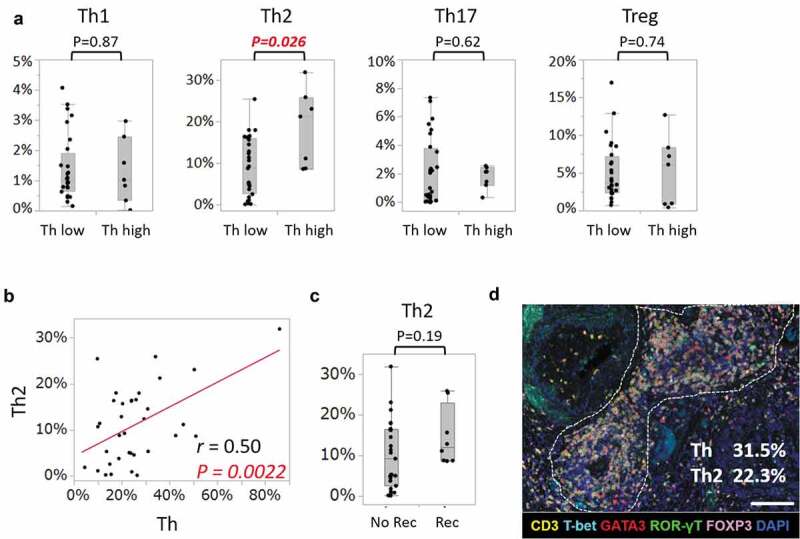
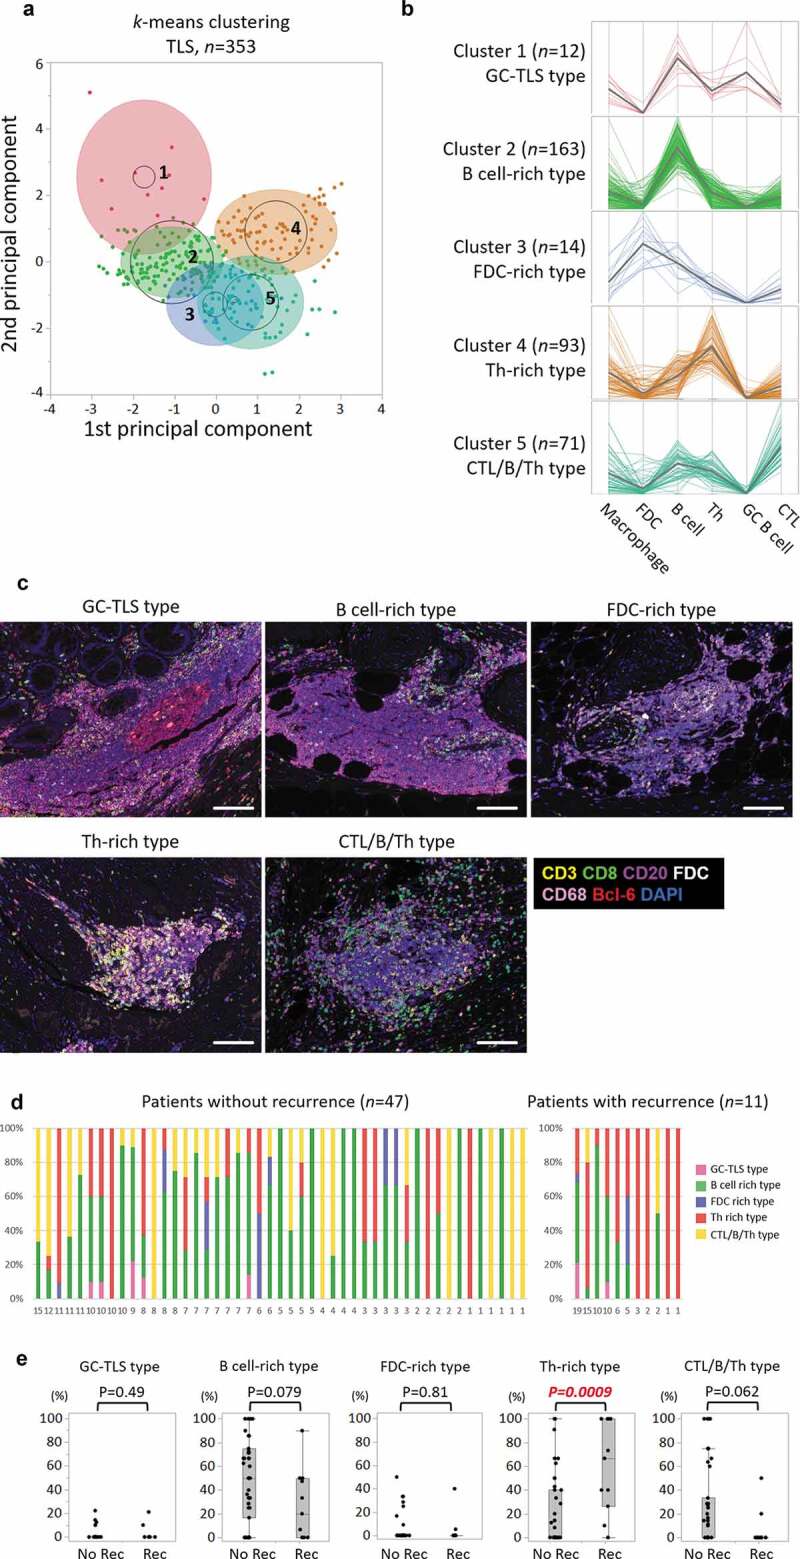
Tertiary lymphoid structures (TLSs), clusters of immune cells found around tumor tissue, have been shown to be associated with anti-tumor immunity, but the cellular composition within each TLS and whether the cellular composition of a TLS affects a patient's prognosis are poorly understood. In the present study, each TLS was categorized according to its cellular composition determined by a system of multiplex immunohistochemical staining and quantitative analysis, and the correlation between the category and prognosis was examined. Sixty-seven patients with curatively resected stage II/III colorectal cancer (CRC) were enrolled. A TLS, consisting of germinal center B cells, follicular dendritic cells, T helper (Th) cells, B cells, cytotoxic T cells, and macrophages, was confirmed in the tumor tissue of 58 patients (87%). The densities of Th cells and macrophages were significantly higher in relapsed patients than in not-relapsed patients (p = .043 and p = .0076). A higher ratio of Th cells was the most significant independent risk factor for disease relapse on multivariate analysis. The subset increasing in Th cells was GATA3+ Th2. A total of 353 TLSs was divided into five clusters according to immune cell composition. Among them, the Th-rich type TLS was significantly increased (p = .0009) in relapsed patients. These data suggest the possibility that Th cell-dominant composition might disturb the anti-tumor immune response, and the function of each TLS might differ depending on its composition.

Keywords: Colorectal cancer; cellular composition; disease relapse; tertiary lymphoid structure.


Figures

Figure 1.
Figure 1.
Representative image of a TLS in CRC tissue. a, The dotted line shows a TLS in CRC tissue (magnification, x200). The slide was stained with CD3 (yellow), CD8 (green), CD20 (purple), FDC (white), CD68 (pink), Bcl-6 (red), and DAPI (blue). Scale bar, 100 µm. b, A TLS displayed separately by each antigen with DAPI. Scale bar, 100 µm. TLS, tertiary lymphoid structure; CRC, colorectal cancer
Figure 2.
Figure 2.
Correlations of TLS-cellular components and clinical signatures. a, Comparisons of numbers of TLSs per 100 mm2 tumor area between two patient groups, divided by age (<65 years, n = 24; ≥65 years, n = 43), pathological stage (stage II, n = 22; stage III, n = 45), side of the primary tumor (right side, n = 26; left side, n = 41), and disease relapse after surgery (no recurrence (No Rec), n = 54; recurrence (Rec), n = 13). b, Comparisons of proportions of cellular components of TLSs between patients without and with disease relapse (no recurrence, n = 47; recurrence, n = 11). Each component is defined as: B cell (CD20+Bcl-6-), Helper T cell (CD3+CD8-Bcl-6-), FDC (FDC+), CTL (CD3+CD8+), macrophage (CD68+), Tfh (CD3+CD8-Bcl-6+), and GC B cell (CD20+Bcl-6+). In both a and (b), P values were calculated by the Wilcoxon rank-sum test. Dots indicate mean values of each patient. Box plots show the median and first and third quartiles, and whiskers extend to 1.5 times the interquartile range of the patient groups. TLS, tertiary lymphoid structure; FDC, follicular dendritic cell; CTL, cytotoxic T lymphocyte; Tfh, follicular helper T cell; GC, germinal center
Figure 3.
Figure 3.
Kaplan-Meier survival curves showing RFS according to proportions of (a) helper T cells (Th), (b) macrophages (Mp), and (c) their combination. P values were calculated by the log-rank test. Vertical lines represent censoring. RFS, relapse-free survival
Figure 4.
Figure 4.
Assessment of increased Th cell subsets in Th-high patients. a, Comparisons of proportions of Th cell subsets between patients with lower densities of Th (Th<34.1%) and those with higher densities (Th≥34.1%) (Th low, n = 28; Th high, n = 7). Each subset is defined as: Th1 (CD3+T-bet+), Th2 (CD3+GATA3+), Th17 (CD3+ROR-γT+), and Treg (CD3+FOXP3+). Dots indicate mean values of each patient. Box plots show the median and first and third quartiles, and whiskers extend to 1.5 times the interquartile range of the patient groups (a,c). P values were calculated by the Wilcoxon rank-sum test (a,c). b, Scatter plot for the proportions of Th cells and CD3+GATA3+ Th2 cells in 35 patients. Correlation coefficients and P values were calculated using Pearson’s correlation coefficient analysis. c, Comparison of proportions of Th2 between patients without and with disease relapse (no recurrence, n = 28; recurrence, n = 7). d, Representative image of TLS in a Th-high patient. The dotted line encircles a TLS in CRC tissue (magnification, x200). Slides were stained with CD3 (yellow), T-bet (cyan), GATA3 (red), ROR-γT (green), FOXP3 (pink), and DAPI (blue). The percentages were calculated as the numbers of CD3+CD8-Bcl-6- (Th) and CD3+GATA3+ (Th2) per all nucleated cells in a TLS. Scale bar, 100 µm. Th, helper T cell
Figure 5.
Figure 5.
Classification of TLS based on the densities of cellular components. a, A biplot of principal components from k-means five-cluster analysis for a total of 353 TLSs with six variables consisting of Th, B cells, FDCs, CTL, GC-B cells, and macrophages. b, Parallel coordinate plots displaying the normalized values of the six variables. The five clusters were separated using k-means cluster analysis. A colored thin line represents a TLS. A gray colored bold line shows the mean value of those variables. c, Representative images of each TLS cluster. Slides were stained with CD3 (yellow), CD20 (purple), CD8 (green), FDC (white), CD68 (pink), Bcl-6 (red), and DAPI (blue). Scale bar, 100 µm. d, Stacked bar charts representing the proportions (%) of the five TLS types per all TLSs in each patient without (n = 47) and with (n = 11) disease recurrence. The horizontal label represents the number of TLSs per patients’ slides. e, Comparisons of the proportions of five types of TLSs between patients without and with disease recurrence (not recurrence, n = 47; recurrence, n = 11). P values were calculated by the Wilcoxon rank-sum test. Dots indicate the value of each patient. Box plots show the median, first and third quartiles, and whiskers extend to 1.5 times the interquartile range of the patient groups. Th, helper T cell; GC, germinal center; TLS, tertiary lymphoid structure; CTL, cytotoxic T lymphocyte; FDC, follicular dendritic cell; No rec, patients without recurrence; Rec, patients with recurrence

Similar articles

Cited by

References

    1. Ferlay J, Soerjomataram I, Dikshit R, Eser S, Mathers C, Rebelo M, Parkin DM, Forman D, Bray F.. Cancer incidence and mortality worldwide: sources, methods and major patterns in GLOBOCAN 2012. Int J Cancer. 2015;136:E359–11. doi:10.1002/ijc.29210. - DOI - PubMed
    1. André T, Boni C, Navarro M, Tabernero J, Hickish T, Topham C, Bonetti A, Clingan P, Bridgewater J, Rivera F, et al. Improved overall survival with oxaliplatin, fluorouracil, and leucovorin as adjuvant treatment in stage II or III colon cancer in the MOSAIC trial. J Clin Oncol. 2009;27:3109–3116. doi:10.1200/JCO.2008.20.6771. - DOI - PubMed
    1. Chen DS, Mellman I. Oncology meets immunology: the cancer-immunity cycle. Immunity. 2013;39:1–10. doi:10.1016/j.immuni.2013.07.012. - DOI - PubMed
    1. Dieu-Nosjean MC, Goc J, Giraldo NA, Sautès-Fridman C, Fridman WH. Tertiary lymphoid structures in cancer and beyond. Trends Immunol. 2014;35:571–580. doi:10.1016/j.it.2014.09.006. - DOI - PubMed
    1. Pitzalis C, Jones GW, Bombardieri M, Jones SA. Ectopic lymphoid-like structures in infection, cancer and autoimmunity. Nat Rev Immunol. 2014;14:447–462. doi:10.1038/nri3700. - DOI - PubMed

Publication types