. 2020 Feb 4:8:e8397.
doi: 10.7717/peerj.8397. eCollection 2020.

Development and validation of statistical shape models of the primary functional bone segments of the foot

Affiliations

Development and validation of statistical shape models of the primary functional bone segments of the foot

Tamara M Grant et al. PeerJ. .

Abstract

Introduction: Musculoskeletal models are important tools for studying movement patterns, tissue loading, and neuromechanics. Personalising bone anatomy within models improves analysis accuracy. Few studies have focused on personalising foot bone anatomy, potentially incorrectly estimating the foot's contribution to locomotion. Statistical shape models have been created for a subset of foot-ankle bones, but have not been validated. This study aimed to develop and validate statistical shape models of the functional segments in the foot: first metatarsal, midfoot (second-to-fifth metatarsals, cuneiforms, cuboid, and navicular), calcaneus, and talus; then, to assess reconstruction accuracy of these shape models using sparse anatomical data.

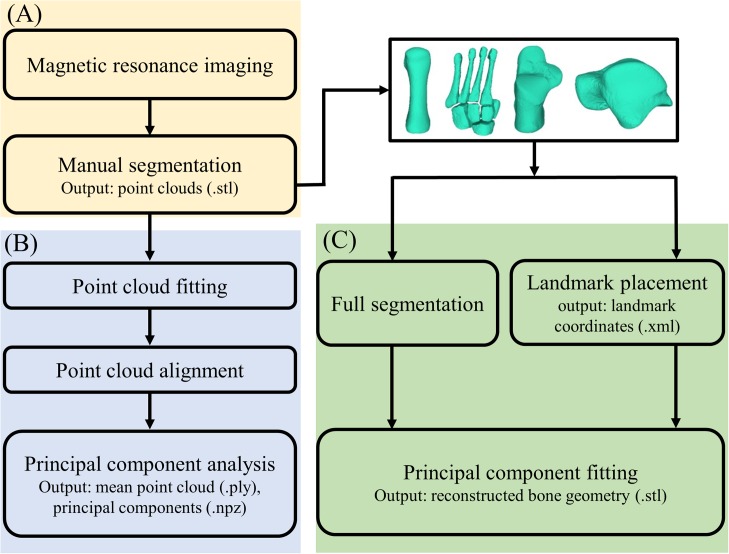
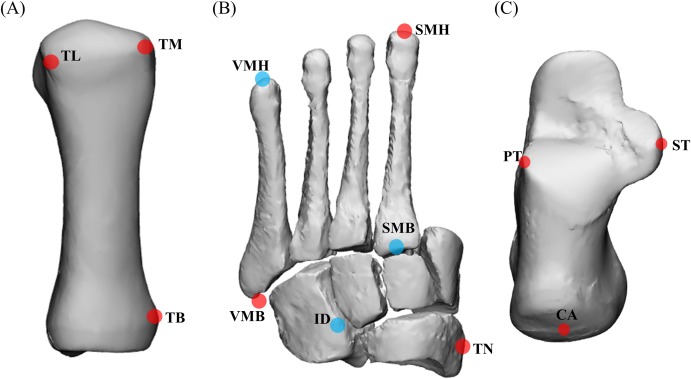
Methods: Magnetic resonance images of 24 individuals feet (age = 28 ± 6 years, 52% female, height = 1.73 ± 0.8 m, mass = 66.6 ± 13.8 kg) were manually segmented to generate three-dimensional point clouds. Point clouds were registered and analysed using principal component analysis. For each bone segment, a statistical shape model and principal components were created, describing population shape variation. Statistical shape models were validated by assessing reconstruction accuracy in a leave-one-out cross validation. Statistical shape models were created by excluding a participant's bone segment and used to reconstruct that same excluded bone using full segmentations and sparse anatomical data (i.e. three discrete points on each segment), for all combinations in the dataset. Tali were not reconstructed using sparse anatomical data due to a lack of externally accessible landmarks. Reconstruction accuracy was assessed using Jaccard index, root mean square error (mm), and Hausdorff distance (mm).

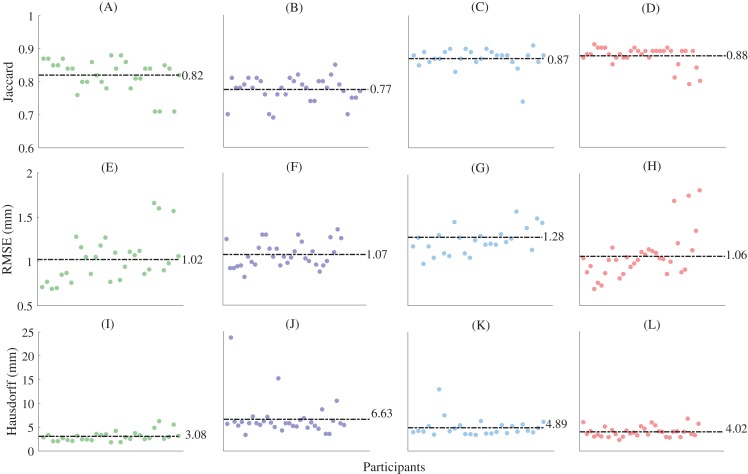
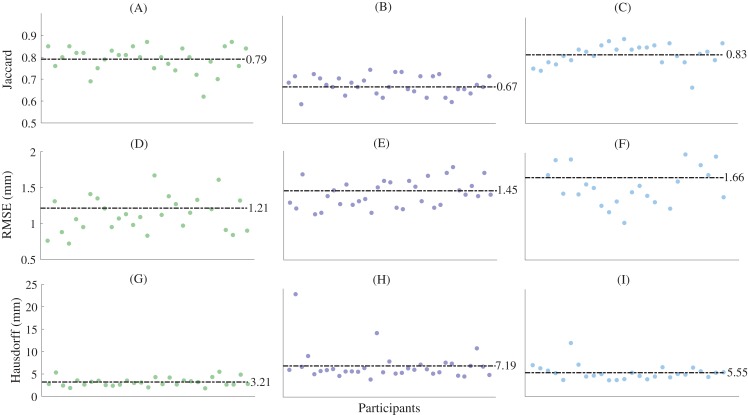
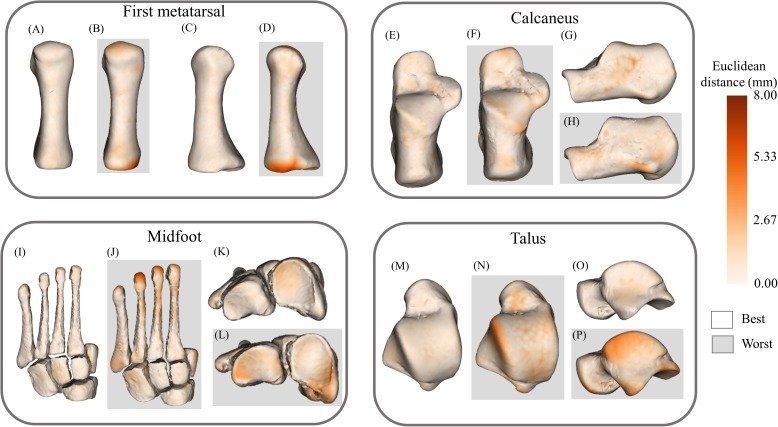
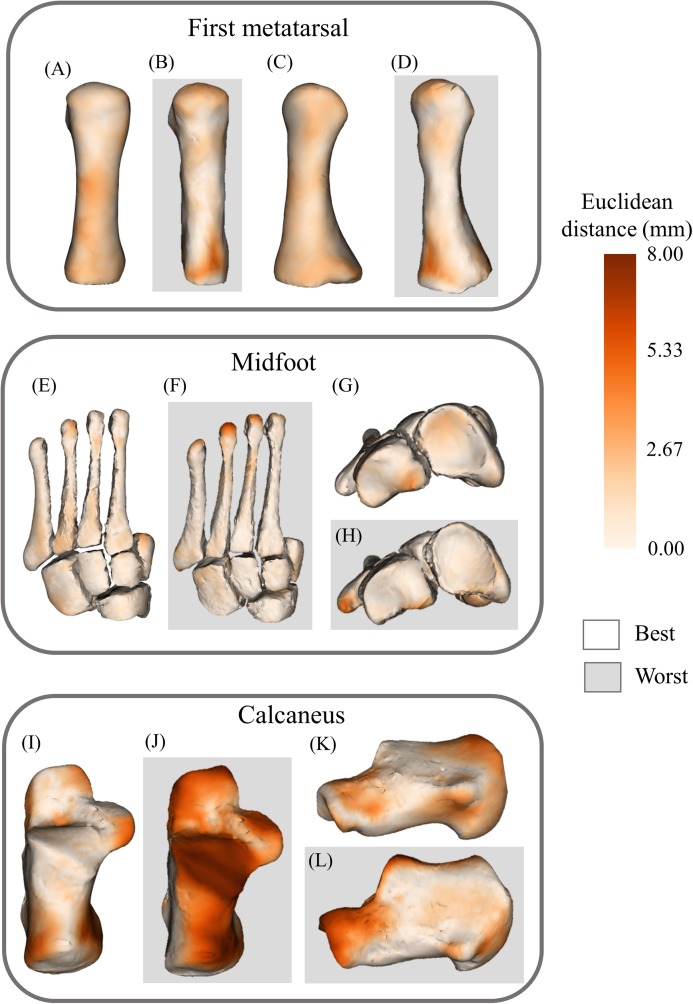
Results: Reconstructions generated using full segmentations had mean Jaccard indices between 0.77 ± 0.04 and 0.89 ± 0.02, mean root mean square errors between 0.88 ± 0.19 and 1.17 ± 0.18 mm, and mean Hausdorff distances between 2.99 ± 0.98 mm and 6.63 ± 3.68 mm. Reconstructions generated using sparse anatomical data had mean Jaccard indices between 0.67 ± 0.06 and 0.83 ± 0.05, mean root mean square error between 1.21 ± 0.54 mm and 1.66 ± 0.41 mm, and mean Hausdorff distances between 3.21 ± 0.94 mm and 7.19 ± 3.54 mm. Jaccard index was higher (P < 0.01) and root mean square error was lower (P < 0.01) in reconstructions from full segmentations compared to sparse anatomical data. Hausdorff distance was lower (P < 0.01) for midfoot and calcaneus reconstructions using full segmentations compared to sparse anatomical data.

Conclusion: For the first time, statistical shape models of the primary functional segments of the foot were developed and validated. Foot segments can be reconstructed with minimal error using full segmentations and sparse anatomical landmarks. In future, larger training datasets could increase statistical shape model robustness, extending use to paediatric or pathological populations.

Keywords: Foot bones; Musculoskeletal modelling; Statistical shape modelling; Subject-specific modelling.


Conflict of interest statement

The authors declare that they have no competing interests.

Figures

Figure 1
Figure 1. Outline of the process of creating and validating a statistical shape model.
(A) Magnetic resonance image processing; (B) statistical shape model generation; and (C) statistical shape model validation.
Figure 2
Figure 2. Percentage of shape variation explained by the first nine principal components for each functional segment.
(A) First metatarsal; (B) calcaneus; (C) midfoot; and (D) talus. Individual bars represent the percentage of shape variation explained by each principal component. A threshold of 80% total shape variation explained was used to determine the number of principal components used for reconstructions from complete segmentation (dashed vertical line). Three principal components were used for reconstructions generated from sparse anatomical landmarks (solid vertical line). The midfoot segment includes the second-to-fifth metatarsal, cuneiforms (medial, intermediate, and lateral), cuboid, and navicular.
Figure 3
Figure 3. Anatomical landmarks used for sparse reconstructions.
(A) First metatarsal; (B) midfoot; and (C) calcaneus. TL = most lateral projection of the head of the first metatarsal; TM = most medial projection of the head of the first metatarsal; TB = most medial projection of the base of the first metatarsal; VMH = head of the fifth metatarsal; SMH = head of the second metatarsal; VMB = base of the fifth metatarsal; SMB = base of the second metatarsal; ID = mid-point between the apex of the tuberosity of the navicular and the base of the fifth metatarsal; TN = most medial apex of the tuberosity of the navicular; PT = lateral apex of the peroneal tubercle of the calcaneus; ST = most medial apex of the sustenaculum tali; and CA = upper central ridge of the posterior surface of the calcaneus. The midfoot segment includes the second-to-fifth metatarsal, cuneiforms (medial, intermediate, and lateral), cuboid, and navicular. Note: (A) based on Leardini et al. (1999), (B) and (C) based on Leardini et al. (2007).
Figure 4
Figure 4. Shape similarity for reconstructions generated from complete magnetic resonance imaging segmentations.
(A) First metatarsal Jaccard indices; (B) midfoot Jaccard indices; (C) calcaneus Jaccard indices; (D) talus Jaccard indices; (E) first metatarsal root mean square error; (F) midfoot root mean square error; (G) calcaneus metatarsal root mean square error; (H) talus metatarsal root mean square error; (I) first metatarsal Hausdorff distances; (J) midfoot Hausdorff distances; (K) calcaneus Hausdorff distances; and (L) talus Hausdorff distances. Horizontal dashed lines represent mean values. The midfoot segment includes the second-to-fifth metatarsals, cuneiforms (medial, intermediate, and lateral), cuboid, and navicular. RMSE—root mean square error.
Figure 5
Figure 5. Shape similarity for reconstructions generated from sparse anatomical landmarks.
(A) First metatarsal Jaccard indices; (B) midfoot Jaccard indices; (C) calcaneus Jaccard indices; (D) first metatarsal root mean square error; (E) midfoot metatarsal root mean square error; (F) calcaneus root mean square error; (G) first metatarsal Hausdorff distances; (H) midfoot Hausdorff distances; and (I) calcaneus Hausdorff distances. Horizontal dashed lines represent mean values. The midfoot segment includes the second-to-fifth metatarsals, cuneiforms (medial, intermediate, and lateral), cuboid, and navicular. RMSE—root mean square error.
Figure 6
Figure 6. Best- and worst-case reconstructions generated from full magnetic resonance imaging (MRI) segmentations in terms of absolute Euclidean distance (mm).
(A) Plantar view of best first metatarsal reconstruction; (B) plantar view of worst first metatarsal reconstruction; (C) medial view of best first metatarsal reconstruction; (D) medial view of worst first metatarsal reconstruction; (E) plantar view of best calcaneus reconstruction; (F) plantar view of worst calcaneus reconstruction; (G) lateral view of best calcaneus reconstruction; (H) lateral view of worst calcaneus reconstruction; (I) plantar view of best midfoot reconstruction; (J) plantar view of worst midfoot reconstruction; (K) proximal view of best midfoot reconstruction; (L) proximal view of worst midfoot reconstruction; (M) plantar view of best talus reconstruction; (N) plantar view of worst talus reconstruction; (O) lateral view of best talus reconstruction; and (P) lateral view of worst talus reconstruction. Non-shaded background: best-case reconstruction from the leave-one-out cross validation; and shaded background: worst-case reconstruction from the leave-one-out cross validation. Euclidean distance is represented by the colour map which ranges from 0 mm (cream) to 8 mm (brown). The midfoot segment includes the second-to-fifth metatarsals, cuneiforms (medial, intermediate, and lateral), cuboid, and navicular bones.
Figure 7
Figure 7. Best- and worst-case reconstructions generated from sparse anatomical data in terms of absolute Euclidean distance (mm).
(A) Plantar view of best first metatarsal reconstruction; (B) plantar view of worst first metatarsal reconstruction; (C) medial view of best first metatarsal reconstruction; (D) medial view of worst first metatarsal reconstruction; (E) plantar view of best midfoot reconstruction; (F) plantar view of worst midfoot reconstruction; (G) proximal view of best midfoot reconstruction; (H) proximal view of worst midfoot reconstruction (I) plantar view of best calcaneus reconstruction; (J) plantar view of worst calcaneus reconstruction; (K) lateral view of best calcaneus reconstruction; and (L) lateral view of worst calcaneus reconstruction. Non-shaded background: best-case reconstruction from the leave-one-out cross validation; and shaded background: worst-case reconstruction from the leave-one-out cross validation. Euclidean distance is represented by the colour map which ranges from 0 mm (cream) to 8 mm (brown). The midfoot segment includes the second-to-fifth metatarsals, cuneiforms (medial, intermediate, and lateral), cuboid, and navicular bones.

References

    1. Bahl JS, Zhang J, Killen BA, Taylor M, Solomon LB, Arnold JB, Lloyd DG, Besier TF, Thewlis D. Statistical shape modelling versus linear scaling: effects on predictions of hip joint centre location and muscle moment arms in people with hip osteoarthritis. Journal of Biomechanics. 2019;85:164–172. doi: 10.1016/j.jbiomech.2019.01.031. - DOI - PubMed
    1. Baka N, De Bruijne M, Van Walsum T, Kaptein BL, Giphart JE, Schaap M, Niessen WJ, Lelieveldt BPF. Statistical shape model-based femur kinematics from biplane fluoroscopy. IEEE Transactions on Medical Imaging. 2012;31(8):1573–1583. doi: 10.1109/TMI.2012.2195783. - DOI - PubMed
    1. Barratt DC, Chan CSK, Edwards PJ, Penney GP, Slomczykowski M, Carter TJ, Hawkes DJ. Instantiation and registration of statistical shape models of the femur and pelvis using 3D ultrasound imaging. Medical Image Analysis. 2008;12(3):358–374. doi: 10.1016/j.media.2007.12.006. - DOI - PubMed
    1. Besl PJ, McKay ND. A method for registration of 3-D shapes. IEEE Transactions on Pattern Analysis and Machine Intelligence. 1992;14(2):239–256. doi: 10.1109/34.121791. - DOI
    1. Bruening DA, Cooney KM, Buczek FL. Analysis of a kinetic multi-segment foot model part II: kinetics and clinical implications. Gait & Posture. 2012;35(4):535–540. doi: 10.1016/j.gaitpost.2011.11.012. - DOI - PubMed

LinkOut - more resources