. 2020 Feb 3:10:46.
doi: 10.3389/fonc.2020.00046. eCollection 2020.

Caveolin-1 Promotes Chemoresistance of Gastric Cancer Cells to Cisplatin by Activating WNT/β-Catenin Pathway

Affiliations

Caveolin-1 Promotes Chemoresistance of Gastric Cancer Cells to Cisplatin by Activating WNT/β-Catenin Pathway

Xi Wang et al. Front Oncol. .

Abstract

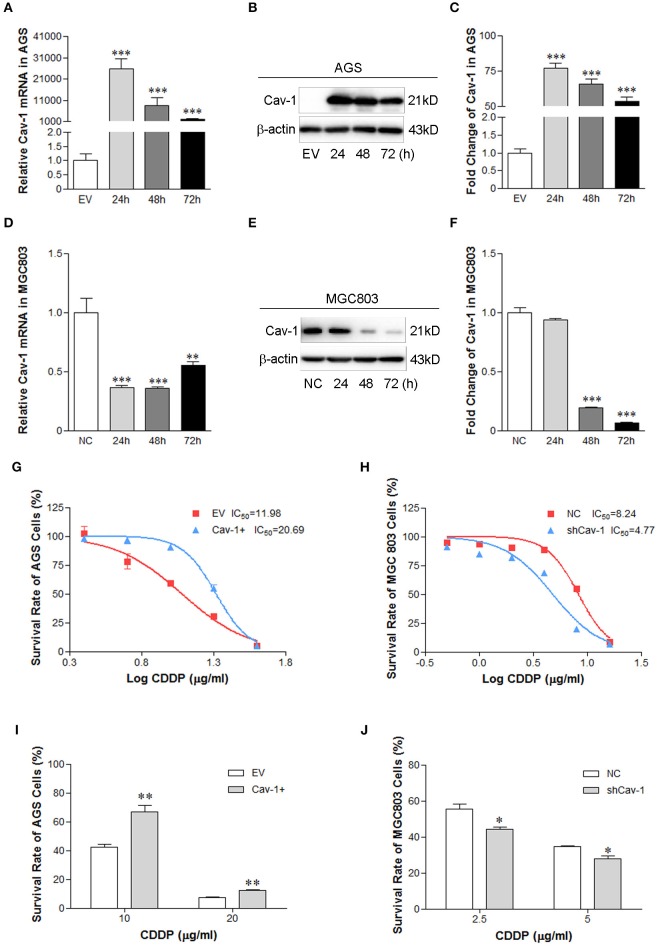
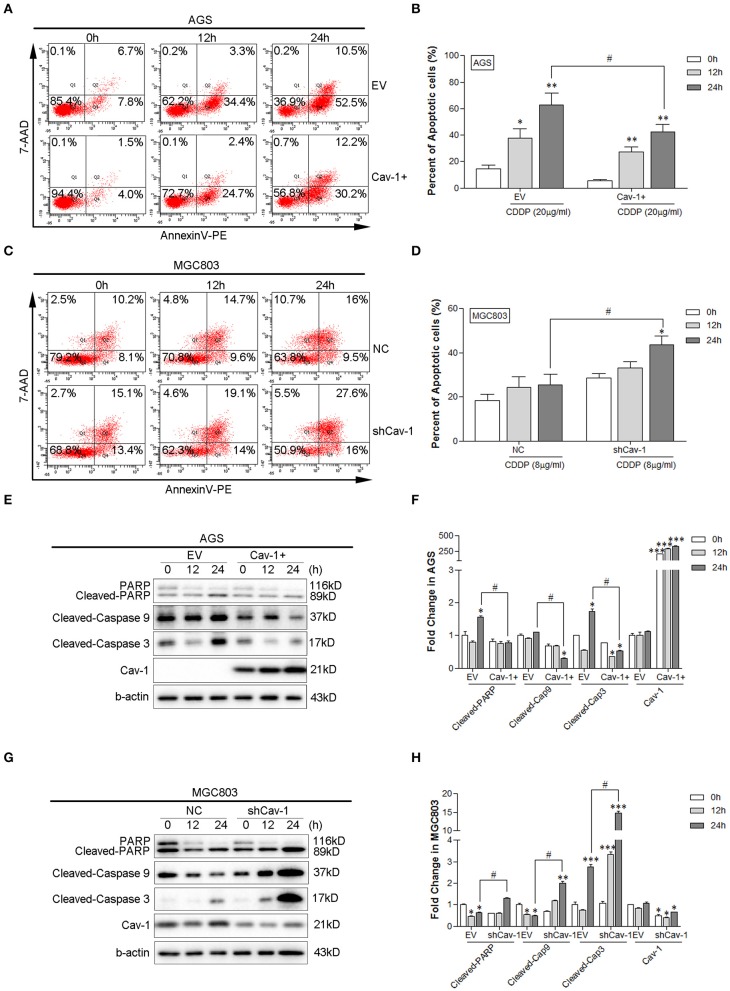
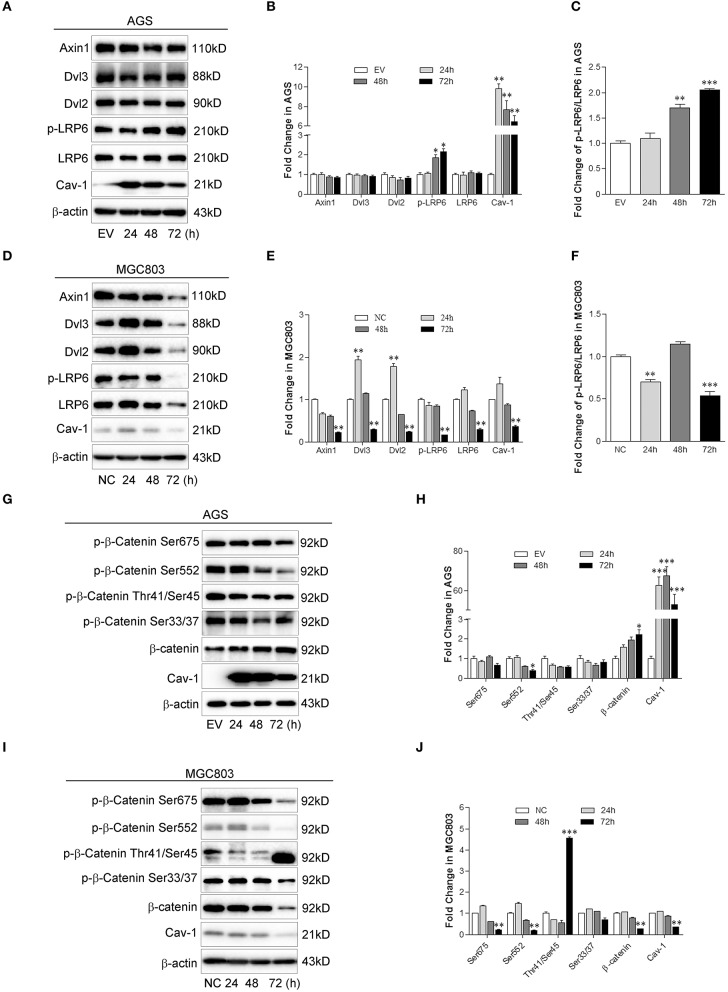
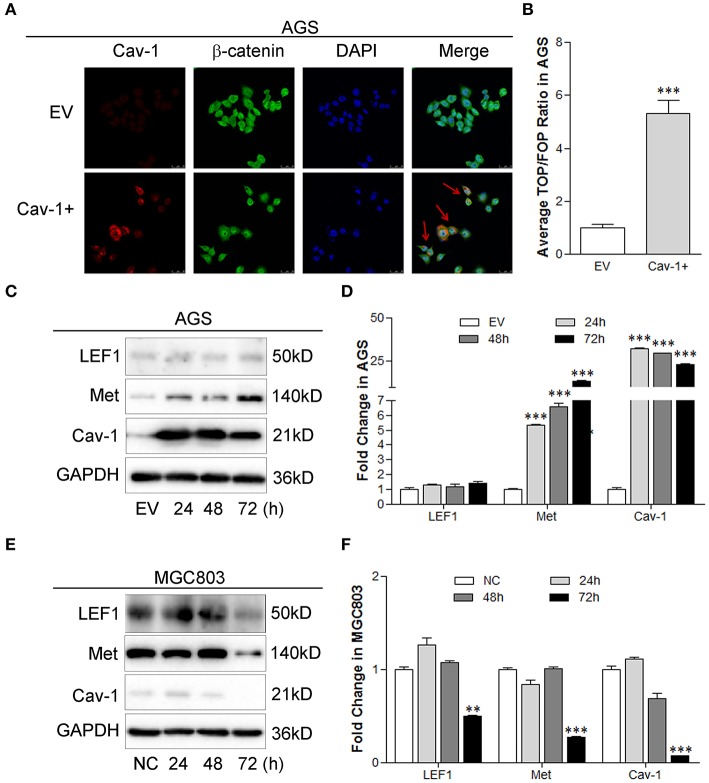
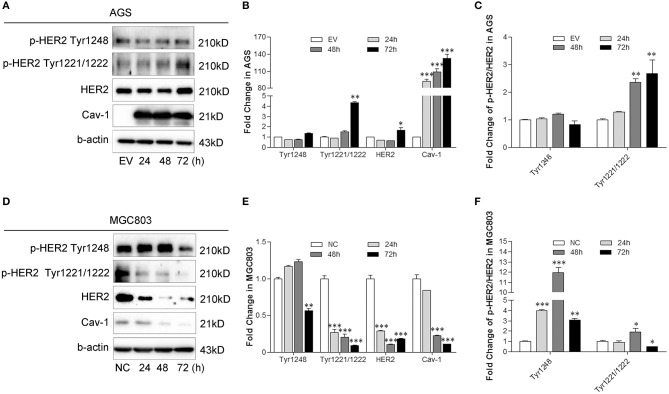
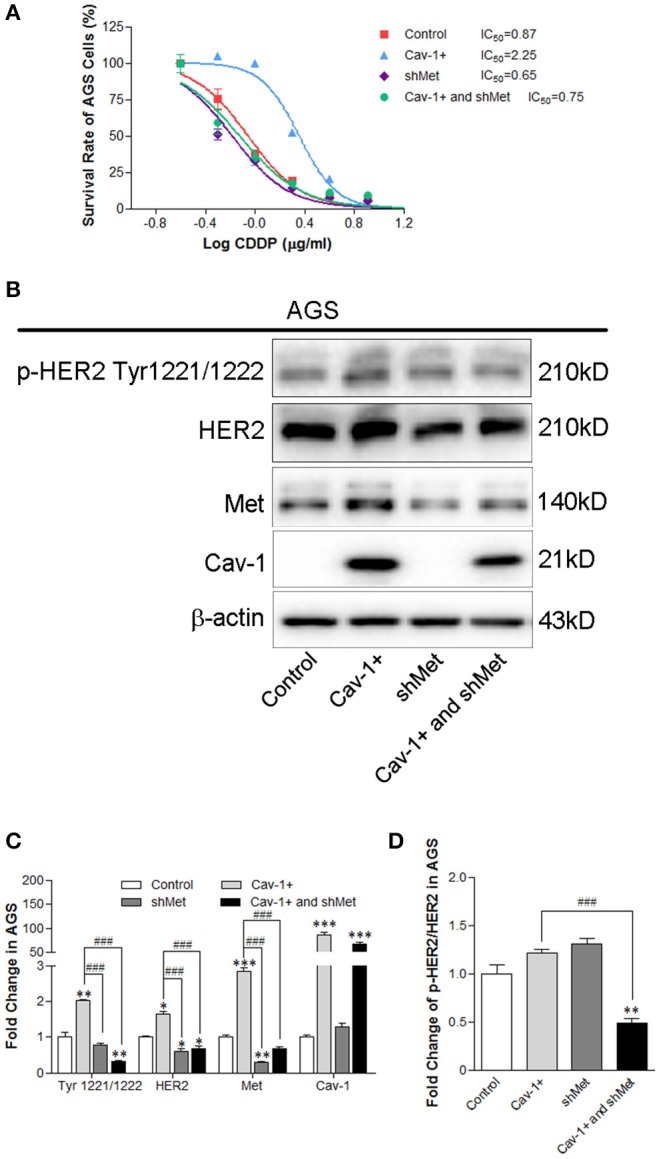
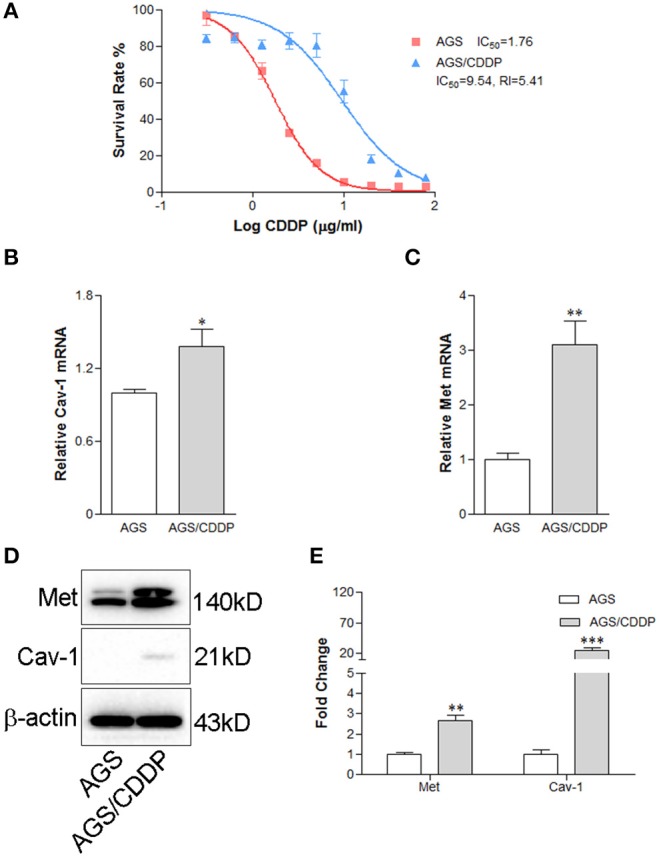
Drug resistance is a major challenge for chemotherapy in treating human gastric cancer (GC), as the underlying molecular mechanism of chemoresistance in GC remains unknown. Caveolin-1 (Cav-1) is a scaffold protein of plasma membrane caveolae that acts as a tumor modulator by interacting with several cell signals. In this research, we showed that the survival rate of GC cells to cisplatin (CDDP) increased in the presence of Cav-1. Moreover, Cav-1 overexpression inhibited cisplatin-induced apoptosis and improved the survival rate of GC cells. Cav-1 overexpression and knock-down experiments indicated that Cav-1 expression stimulated wingless-type MMTV integration site (WNTs) pathway through the phosphorylation of LRP6 and dephosphorylation of β-catenin. Cav-1 was positively associated with the increase of WNT downstream target gene Met, which led to the activation of HER2 signaling. Moreover, our results demonstrated that the expression of Cav-1 and Met were positively associated with the resistance of GC cells to cisplatin. Collectively, Cav-1 enhances the cisplatin-resistance of GC cells by activating the WNT signaling pathway and Met-HER2 crosstalk. Understanding the role of Cav-1 in the chemoresistance of GC would help to develop novel therapies for a better treatment outcome of GC patients.

Keywords: Caveolin-1; WNT/β-catenin pathway; chemoresistance; cisplatin; gastric cancer.


Figures

Figure 1
Figure 1
Cav-1 induces the survival of GC cell lines in the presence of cisplatin chemotherapy. (A) The mRNA expression level of Cav-1 was significant up-regulated in Cav-1-transfected AGS cells compared with control cells. (B) The protein level was in consistent with the mRNA expression of Cav-1. (C) The relative protein level of Cav-1 in AGS cells was analyzed. (D) The endogenous expression of Cav-1 mRNA in MGC 803 cells was mostly inhibited after the cells were transfected with shCav-1 vector for 24 h. (E) The protein level of Cav-1 was decreased after the cells were transfected with shCav-1 for 48 h. (F) The relative protein level of Cav-1 in MGC803 cells was analyzed. (G–J) Cav-1-overexpression or –repression GC cells were treated with increasing concentrations of cisplatin for 24 h. Cell viability was assessed by CCK-8 assay. AGS/Cav-1+ and MGC803/NC cells were more resistant than AGS/EV (G) and MGC803/shCav-1 cells (H). The survival of AGS/Cav-1+ cells was increased in the presence of cisplatin at the concentration of 10 and 20 μg/ml (I). The survival of MGC803/shCav-1 cells was decreased in the presence of cisplatin at the concentration of 2.5 and 5 μg/ml (J). The fold change of protein was standardized according to the protein levels in the EV or NC group. Optical density (OD) values are calculated as % survival ± SEM (n = 3) of controls. Data are shown as mean ± SEM (n = 3). *P < 0.05, **P < 0.01, ***P < 0.001 compared with the empty vector or negative control. CDDP, cisplatin.
Figure 2
Figure 2
Cav-1 attenuates apoptotic response induced by cisplatin in GC cells. (A) Overexpression of Cav-1 inhibited the apoptosis of AGS cells. (B) Statistical analysis of the apoptotic rate of AGS cell population after CDDP treatment. (C) Knock-down of Cav-1 enhanced the apoptosis of MGC803 cells. (D) Statistical analysis of the apoptotic rate of MGC803 cell population after CDDP treatment. (E) The expression of cleaved caspase-3, cleaved caspase-9, and cleaved PARP were notably down-regulated in AGS/Cav-1+ cells compared with AGS/EV cells. (F) The relative levels of cleaved caspase-3, cleaved caspase-9, cleaved PARP and Cav-1 in AGS cells were analyzed. (G) Knock-down of Cav-1 substantially increased the levels of cleaved caspase-3, cleaved caspase-9, and cleaved PARP in MGC803/shCav-1 cells compared with MGC803/NC cells. (H) The relative levels of cleaved caspase-3, cleaved caspase-9, cleaved PARP, and Cav-1 in MGC803 cells were analyzed. Data are shown as mean ± SEM (n = 3). *P < 0.05, **P < 0.01, ***P <0.001 compared with AGS/EV cells or MGC803/NC cells. #P <0.05 compared with CDDP for 24 h after transfected with the empty or negative control vector. CDDP, cisplatin.
Figure 3
Figure 3
Cav-1 regulates the activation of key molecules involved in canonical WNT signaling pathway. (A) Overexpression of Cav-1 increased the phosphorylation of LRP6 but not the expression of Axin1, Dvl2, Dvl3, and total LRP6 in AGS/Cav-1+ cells compared with AGS/EV cells. (B) The relative levels of Axin1, Dvl2, Dvl3, p-LRP6, total LRP6, and Cav-1 in AGS cells were analyzed. (C) The fold change of p-LRP6 relative to total LPR6 in AGS cells was analyzed. (D) Knock-down of Cav-1 obviously inhibited the phosphorylation of LRP6, as well as expression of Axin1, Dvl2, Dvl3, and total LRP6 in MGC803/shCav-1 cells compared with MGC803/NC cells. (E) The relative levels of Axin1, Dvl2, Dvl3, p-LRP6, total LRP6, and Cav-1 in MGC803 cells were analyzed. (F) The fold change of p-LRP6 relative to total LPR6 in MGC803 cells was analyzed. (G) Following the activation in the upstream molecules of β-catenin, the phosphorylation of β-catenin at Ser552 site was notably reduced, while total β-catenin was increased in AGS/Cav-1+ cells compared with AGS/EV cells. (H) The relative levels of p-β-catenin at Ser33/37, Tyr41/Ser45, Ser552, and Ser675 sites, total β-catenin and Cav-1 in AGS cells were analyzed. (I) Knock-down of Cav-1 obviously increased phosphorylation of β-catenin at Thr41/Ser45 sites but decreased total β-catenin in MGC803 cells, although there was a little effect on the dephosphorylation of β-catenin at Ser33/37, Ser552, and Ser675. (J) The relative levels of p-β-catenin at Ser33/37, Tyr41/Ser45, Ser552, and Ser675 sites, total β-catenin and Cav-1 in MGC803 cells were analyzed. Data are shown as mean ± SEM (n = 3). *P < 0.05, **P < 0.01, ***P <0.001 compared with the EV or NC group.
Figure 4
Figure 4
Cav-1 induces the expression of target genes by activating the β-catenin pathway. (A) The immunofluorescence images showed that more β-catenin was located in the nucleus after transfected with Cav-1 for 72 h (as shown in red arrow). (B) TOP/FOP flash luciferase analysis showed that the level of β-catenin-LEF/TCF transcription was remarkably elevated by the overexpression of Cav-1. (C) The expression of Met was significantly increased in AGS cells at 24 h post Cav-1 transfection, while Cav-1 didn't affect the expression of LEF1. (D) The relative levels of LEF1, Met, and Cav-1 in AGS cells were analyzed. (E) The protein levels of LEF1 and Met were both reduced in Cav-1-repressed MGC803 cells at 72 h post Cav-1 transfection. (F) The relative levels of LEF1, Met, and Cav-1 in MGC803 cells were analyzed. Data are shown as mean ± SEM (n = 3). **P < 0.01, ***P <0.001 compared with the EV or NC group.
Figure 5
Figure 5
Cav-1 induces the activation of HER2 in GC cells. (A) Cav-1 stimulated the phosphorylation of HER2 at Tyr1221/1222 sites, but had no effect on the Tyr1248 phosphorylation in AGS/Cav-1+ cells compared with AGS/EV cells. (B) The relative levels of p-HER2 at Tyr1221/1222 and Tyr1248 sites, total HER2 and Cav-1 in AGS cells were analyed. (C) The fold change of p-HER2 relative to total HER2 in AGS cells was analyzed. (D) Both total and phosphorylated HER2 expression levels were attenuated in MGC803/shCav-1 cells compared with MGC803/NC cells. (E) The relative levels of p-HER2 at Tyr1221/1222 and Tyr1248 sites, total HER2 and Cav-1 in MGC803 cells were analyzed. (F) The fold change of p-HER2 relative to total HER2 in MGC803 cells was analyed. Data are shown as mean ± SEM (n = 3). *P < 0.05, **P < 0.01, ***P <0.001 compared with the EV or NC group.
Figure 6
Figure 6
Knock-down of Met prevents the Cav-1-induced cisplatin resistance of AGS cells by targeting the Met and HER2 pathway. (A) The viability of AGS/Cav-1+ cells was elevated compared with AGS cells, while AGS/shMet cells were more sensitive to cisplatin than AGS/Cav-1+ cells. (B) Cav-1 stimulated the activation of Met, p-HER2 at Tyr1221/1222 site and total HER2 in AGS cells. Met silencing inhibited the increase of p-HER2 at Tyr1221/1222 site and total HER2 induced by Cav-1. (C) The relative levels of p-HER2 at Tyr1221/1222, total HER2 and Cav-1 in AGS cells were analyzed. (D) The fold change of p-HER2 relative to total HER2 in AGS cells was analyzed. *P < 0.05, **P < 0.01, ***P < 0.001 compared with control group. ###P <0.001 compared with Cav-1 overexpression group. CDDP, cisplatin.
Figure 7
Figure 7
Cav-1-dependent increase of Met leads to the cisplatin-resistance of gastric cancer cells. (A) The cell survival rate of AGS/CDDP cells was elevated compared with AGS cells. AGS/CDDP cells showed stronger anti-cisplatin capability than their parental cells. (B) AGS/CDDP cells showed a higher level of Cav-1 mRNA compared with control cells. (C) Met mRNA expression was markedly increased in AGS/CDDP cells. (D) The protein levels of Cav-1 and Met were in consistent with the mRNA expression in AGS cells. (E) The relative levels of Met and Cav-1 in AGS and AGS/CDDP cells were analyzed. Data are shown as mean ± SEM (n = 3). *P < 0.05, **P < 0.01, ***P <0.001 compared with AGS cells. CDDP, cisplatin.

Similar articles

Cited by

References

    1. Jemal A, Center MM, DeSantis C, Ward EM. Global patterns of cancer incidence and mortality rates and trends. Cancer Epidemiol Biomarkers Prev. (2010) 19:1893–907. 10.1158/1055-9965.EPI-10-0437 - DOI - PubMed
    1. Becker K, Langer R, Reim D, Novotny A, Meyer zum Buschenfelde C, Engel J, et al. . Significance of histopathological tumor regression after neoadjuvant chemotherapy in gastric adenocarcinomas: a summary of 480 cases. Ann Surg. (2011) 253:934–9. 10.1097/SLA.0b013e318216f449 - DOI - PubMed
    1. Huang D, Duan H, Huang H, Tong X, Han Y, Ru G, et al. . Cisplatin resistance in gastric cancer cells is associated with HER2 upregulation-induced epithelial-mesenchymal transition. Sci Rep. (2016) 6:20502. 10.1038/srep20502 - DOI - PMC - PubMed
    1. Cohen AW, Hnasko R, Schubert W, Lisanti MP. Role of caveolae and caveolins in health and disease. Physiol Rev. (2004) 84:1341–79. 10.1152/physrev.00046.2003 - DOI - PubMed
    1. Goetz JG, Lajoie P, Wiseman SM, Nabi IR. Caveolin-1 in tumor progression: the good, the bad and the ugly. Cancer Metastasis Rev. (2008) 27:715–35. 10.1007/s10555-008-9160-9 - DOI - PubMed