. 2020 Feb 7:8:31.
doi: 10.3389/fcell.2020.00031. eCollection 2020.

The Lysosomal Membrane Protein Lamp2 Alleviates Lysosomal Cell Death by Promoting Autophagic Flux in Ischemic Cardiomyocytes

Affiliations

The Lysosomal Membrane Protein Lamp2 Alleviates Lysosomal Cell Death by Promoting Autophagic Flux in Ischemic Cardiomyocytes

Lin Cui et al. Front Cell Dev Biol. .

Abstract

Lysosomal membrane permeabilization (LMP) has recently been recognized as an important cell death pathway in various cell types. However, studies regarding the correlation between LMP and cardiomyocyte death are scarce. Lysosomal membrane-associated protein 2 (Lamp2) is an important component of lysosomal membranes and is involved in both autophagy and LMP. In the present study, we found that the protein content of Lamp2 gradually decreased in response to oxygen, glucose and serum deprivation (OGD) treatment in vitro. To further elucidate its role in ischemic cardiomyocytes, particularly with respect to autophagy and LMP, we infected cardiomyocytes with adenovirus carrying full-length Lamp2 to restore its protein level in cells. We found that OGD treatment resulted in the occurrence of LMP and a decline in the viability of cardiomyocytes, which were remarkably reversed by Lamp2 restoration. Exogenous expression of Lamp2 also significantly alleviated the autophagic flux blockade induced by OGD treatment by promoting the trafficking of cathepsin B (Cat B) and cathepsin D (Cat D). Through drug intervention and gene regulation to alleviate and exacerbate autophagic flux blockade respectively, we found that impaired autophagic flux in response to ischemic injury contributed to the occurrence of LMP in cardiomyocytes. In conclusion, our present data suggest that Lamp2 overexpression can improve autophagic flux blockade probably by promoting the trafficking of cathepsins and consequently conferring cardiomyocyte resistance against lysosomal cell death (LCD) that is induced by ischemic injury. These results may indicate a new therapeutic target for ischemic heart damage.

Keywords: LMP; Lamp2; OGD; autophagic flux; cardiomyocytes.


Figures

FIGURE 1
FIGURE 1
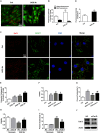
Lamp2 overexpression promotes resistance against OGD stress in cardiomyocytes. (A) Western blotting was performed to detect Lamp1 and Lamp2 levels after OGD treatment for different periods. (B) Quantitative analysis of the immunoblots in (A). The data represent the mean ± SEM (n = 5). *P < 0.05 and **P < 0.01 versus the control group. (C) Representative confocal images of Lamp1 and Lamp2 after OGD treatment for 9 h. Scale bar, 10 μm. (D) Quantitative analysis of the fluorescence in (C). Mean ± SEM. n = 3. **P < 0.01 versus the control group. (E) Cell viability was determined with a CCK-8 assay and was normalized to that of the control group. Mean ± SEM. n = 3. **P < 0.01 versus the normoxia + NC group, ##P < 0.01 versus the OGD + NC group. (F) LDH leakage analysis was performed to determine cell death. Mean ± SEM. n = 3. **P < 0.01 versus the normoxia + NC group, ##P < 0.01 versus the OGD + NC group.
FIGURE 2
FIGURE 2
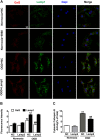
LMP is involved in ischemic/hypoxic injury of cardiomyocytes. (A) Representative images of the acridine orange staining after OGD treatment for 9 h. Bar, 25 μm. (B) Quantitative analysis of the images in (A). Mean ± SEM. n = 5. **P < 0.01 versus the control group. (C) Gal3 immunofluorescence was used to determine lysosomal membrane injury. Bar, 10 μm. (D) Quantitative analysis of Gal3 immunofluorescence intensity. Mean ± SEM. n = 3. *P < 0.05 versus the control group. (E) Results from the extraction of the cytoplasm without lysosomes after OGD treatment for 3, 6, and 9 h with digitonin solution (17 μg/ml) to detect cathepsin B activity. Mean ± SEM. n = 3. **P < 0.01 versus the control group. (F) Cell viability was assessed by CCK-8 analysis, and the value was normalized to that of the control group. CA074 (20 μM) and pep A (12.5 μg/ml) alleviated the cell injury induced by OGD stress. Mean ± SEM. n = 3. **P < 0.01 versus the control group and #P < 0.05, ##P < 0.01 versus the OGD group. (G) Cell injury was determined by LDH leakage analysis. Mean ± SEM. n = 3. **P < 0.01 versus the control group, ##P < 0.01 versus the OGD group. (H) Cat D siRNA improved cell viability as determined by CCK-8 analysis. Mean ± SEM. n = 3. **P < 0.01 versus the normoxia + NC group and #P < 0.05 versus the OGD + NC group. (I) LDH leakage analysis was used to assess the cell injury. Mean ± SEM. n = 3. **P < 0.01 versus the normoxia + NC group, ##P < 0.01 versus the OGD + NC group. (J) Western blotting of Cat D was performed to detect the transfection efficiency of Cat D siRNA.
FIGURE 3
FIGURE 3
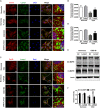
Exogenous overexpression of Lamp2 inhibits LMP in OGD-treated cardiomyocytes. (A,B) Representative confocal immunofluorescence images (A) and quantitative analysis of the Gal3 and Lamp1 level after OGD treatment for 9 h (B). Scale bar, 10 μm. For the quantitative analysis, the data are presented as the means ± SEM (n = 3). **P < 0.01 versus the normoxia + NC group, ##P < 0.01 versus the OGD + NC group. (C) Detection of the activity of cytosolic cathepsin B without lysosomal fractions. Mean ± SEM. n = 3. **P < 0.01 versus the normoxia + NC group, ##P < 0.01 versus the OGD + NC group.
FIGURE 4
FIGURE 4
Lamp2 restoration rescues the autophagic flux blockade caused by OGD treatment. (A,B) Western blotting (A) and quantitative analysis (B) of LC3 and SQSTM1 in response to OGD treatment for 3, 6, and 9 h. Mean ± SEM (n = 3). **P < 0.01 versus the control group. (C,D) Western blotting (C) and quantitative analysis (D) of LC3 and SQSTM1 with rapamycin (200 nM), 3-MA (1 mM) and CQ (20 μM) treatment. Mean ± SEM (n = 3). **P < 0.01 versus the control group and #P < 0.05, ##P < 0.01 versus the OGD group. (E,F) Western blotting of LC3, SQSTM1 and Lamp2 with exogenously infected full-length Lamp2 adenovirus (E) and results from the quantitative analysis (F). Mean ± SEM (n = 3). *P < 0.05, **P < 0.01 versus the normoxia + NC group and #P < 0.05, ##P < 0.01 versus the OGD + NC group. (G,H) Cardiomyocytes were treated with rapamycin, 3-MA or CQ with or without Lamp2 overexpression and Western blotting was performed to determine the levels of LC3 and SQSTM1 (G). Quantitative analysis (H) of these results is presented as the mean ± SEM (n = 3). *P < 0.05, **P < 0.01 versus the OGD + NC group and ##P < 0.01 versus the OGD + Lamp2 group. (I) Representative confocal images of mCherry-GFP-LC3. Bar, 10 μm. (F) Quantitative analysis of (J) is presented as the mean ± SEM (n = 3). **P < 0.01 versus the normoxia + NC group and #P < 0.05, ##P < 0.01 versus the OGD + NC group. (L) DALGreen fluorescent dye detection. Scale bar, 10 μm. (K) Quantitative analysis of (L). Mean ± SEM (n = 3). **P < 0.01 versus the normoxia + NC group, ##P < 0.01 versus the OGD + NC group.
FIGURE 5
FIGURE 5
Overexpression of Lamp2 alleviates dysfunction of the cathepsin trafficking induced by OGD treatment. (A,B) Double staining of cathepsins and Lamp1 to determine the trafficking of cathepsin D (A) and cathepsin B (B). Scale bar, 10 μm. (C,D) Quantitative analysis of (A,B). Mean ± SEM (n = 3). **P < 0.01 versus the normoxia + NC group and #P < 0.05, ##P < 0.01 versus the OGD + NC group. (E,F) Western blotting was performed to determine the protein levels of CD-M6PR and Cl-M6PR with Lamp2 overexpression (E). Quantitative analysis (F) is presented as the mean ± SEM (n = 3). **P < 0.01 versus the normoxia + NC group, ##P < 0.01 versus the OGD + NC group.
FIGURE 6
FIGURE 6
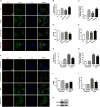
Autophagic flux blockade accounts for the OGD-induced LMP in cardiomyocytes. (A,B) Immunostaining of Gal3 after treatment with OGD with 3-MA (1 mM) or CQ (20 μM) (A). Quantitative analysis (B). Scale bar, 10 μm. Mean ± SEM (n = 3). **P < 0.01 versus the control group, ##P < 0.01 versus the OGD group. (C) The extent of LMP with 3-MA (1 mM) or CQ (20 μM) treatment was determined by the activity of cytosolic cathepsin B. Mean ± SEM (n = 3). **P < 0.01 versus the control group and #P < 0.05, ##P < 0.01 versus the OGD group. (D) A CCK-8 assay was performed to evaluate cell viability. Mean ± SEM (n = 3). **P < 0.01 versus the control group, ##P < 0.01 versus the OGD group. (E) Cytotoxicity was determined by LDH leakage experiments. Mean ± SEM (n = 5). **P < 0.01 versus the control group, #P < 0.05, ##P < 0.01 versus the OGD group. (F,G) Representative images of Gal3 with ATG5 siRNA (F). Quantitative analysis (G). Scale bar, 10 μm. Mean ± SEM (n = 3). **P < 0.01 versus the normoxia + NC group and ##P < 0.01 versus the OGD + NC group. (H) Detection of the activity of cytosolic cathepsin B after transfection with ATG5 siRNA. Mean ± SEM (n = 3). **P < 0.01 versus the normoxia + NC group and ##P < 0.01 versus the OGD + NC group. (I) Cell viability was detected by CCK-8 assay. Mean ± SEM (n = 4). **P < 0.01 versus the normoxia + NC group, #P < 0.05 versus the OGD + NC group. (J) Cytotoxicity was assessed by LDH leakage experiments. Mean ± SEM (n = 3). **P < 0.01 versus the normoxia + NC group and ##P < 0.01 versus the OGD + NC group. (K) Western blotting was performed to detect the transfection efficiency of ATG5 siRNA.
FIGURE 7
FIGURE 7
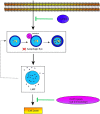
Lamp2 protects cardiomyocytes from OGD treatment. Schematic diagram on the proposed pathway that Lamp2 improved the impaired autophagic flux and thus alleviates LMP and cell death of cardiomyocytes caused by OGD treatment.

References

    1. Cenacchi G., Papa V., Pegoraro V., Marozzo R., Fanin M., Angelini C. (2019). Danon disease: review of natural history and recent advances. Neuropathol. Appl. Neurobiol. 10.1111/nan.12587 [Epub ahead of print]. - DOI - PubMed
    1. Clerc P., Jeanjean P., Hallali N., Gougeon M., Pipy B., Carrey J., et al. (2018). Targeted magnetic intra-lysosomal hyperthermia produces lysosomal reactive oxygen species and causes Caspase-1 dependent cell death. J. Control. Release 270 120–134. 10.1016/j.jconrel.2017.11.050 - DOI - PubMed
    1. Damaghi M., Tafreshi N. K., Lloyd M. C., Sprung R., Estrella V., Wojtkowiak J. W., et al. (2015). Chronic acidosis in the tumour microenvironment selects for overexpression of LAMP2 in the plasma membrane. Nat. Commun. 6:8752. 10.1038/ncomms9752 - DOI - PMC - PubMed
    1. de Duve C. (2005). The lysosometurns fifty. Nat. Cell Biol. 7 847–849. - PubMed
    1. Diaz E., Pfeffer S. R. (1998). TIP47: a cargo selection device for mannose 6-phosphate receptor trafficking. Cell 93 433–443. 10.1016/s0092-8674(00)81171-x - DOI - PubMed