. 2020 Jan;7(1):015008.
doi: 10.1117/1.NPh.7.1.015008. Epub 2020 Feb 22.

Improving model-based functional near-infrared spectroscopy analysis using mesh-based anatomical and light-transport models

Affiliations

Improving model-based functional near-infrared spectroscopy analysis using mesh-based anatomical and light-transport models

Anh Phong Tran et al. Neurophotonics. 2020 Jan.

Abstract

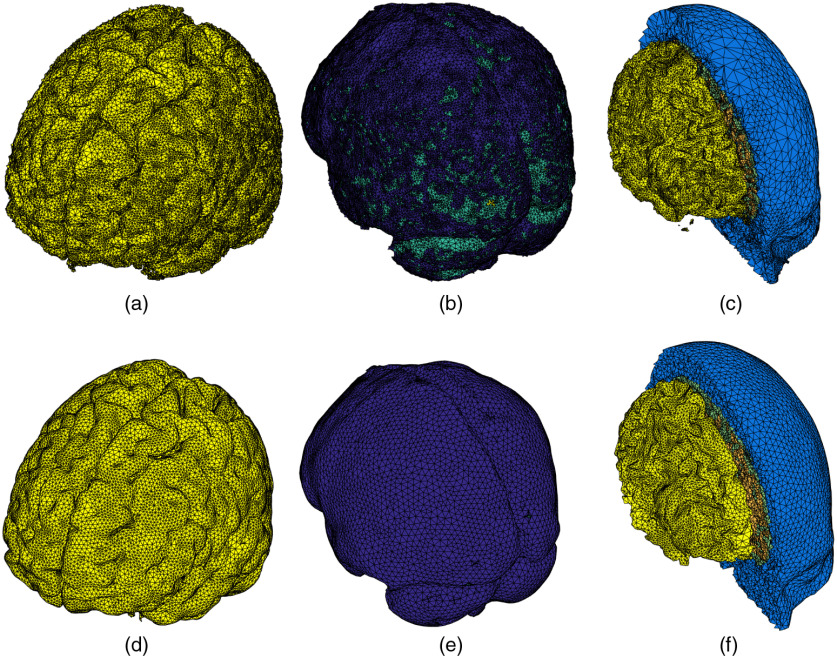
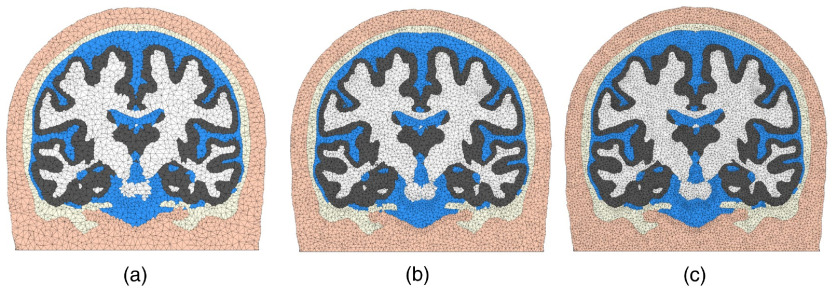
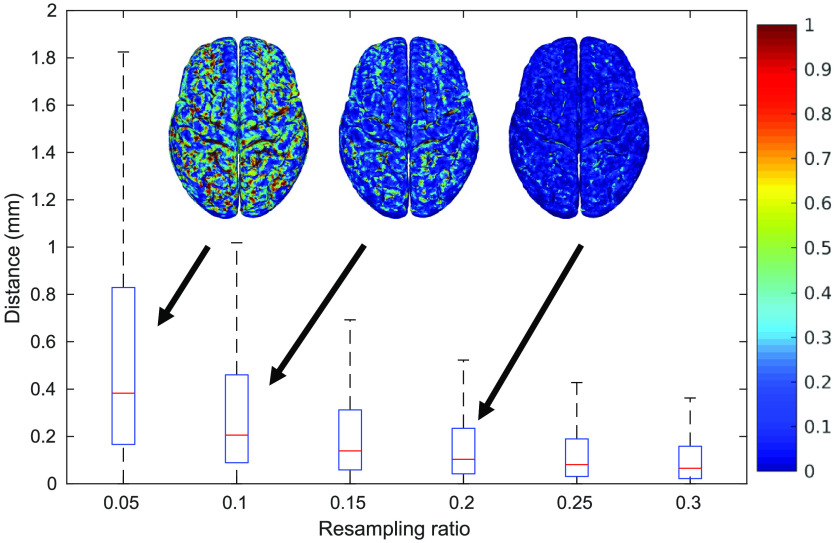
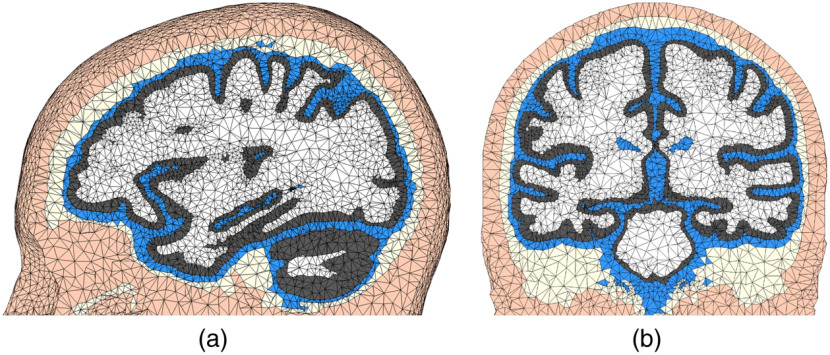
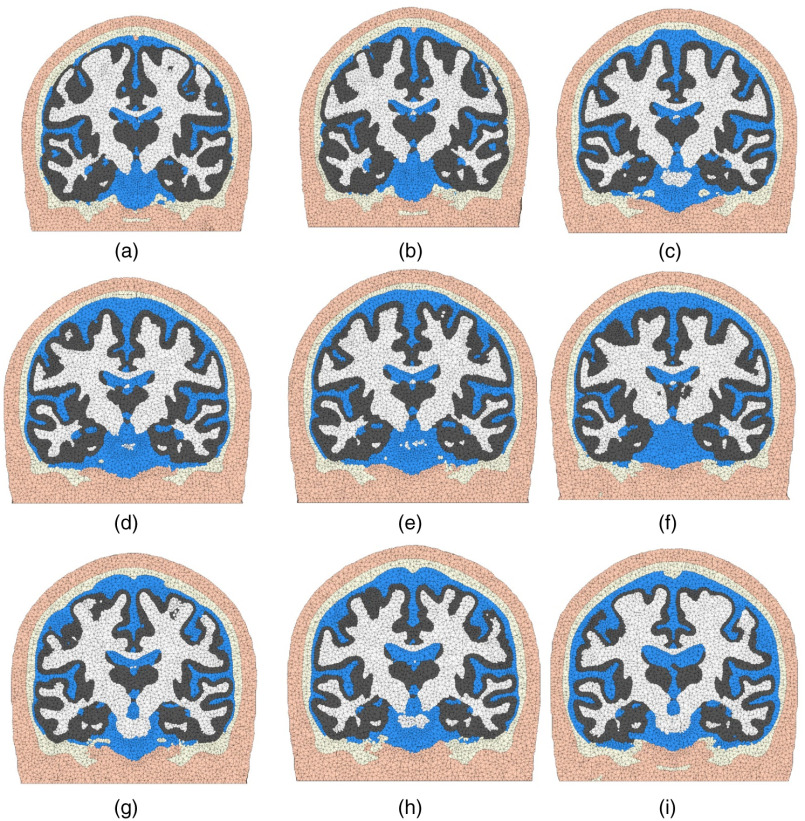
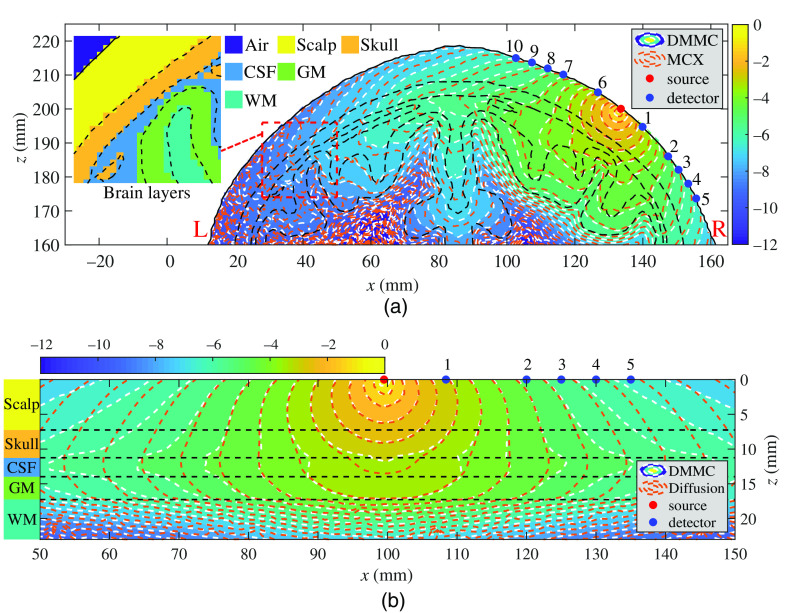
Significance: Functional near-infrared spectroscopy (fNIRS) has become an important research tool in studying human brains. Accurate quantification of brain activities via fNIRS relies upon solving computational models that simulate the transport of photons through complex anatomy. Aim: We aim to highlight the importance of accurate anatomical modeling in the context of fNIRS and propose a robust method for creating high-quality brain/full-head tetrahedral mesh models for neuroimaging analysis. Approach: We have developed a surface-based brain meshing pipeline that can produce significantly better brain mesh models, compared to conventional meshing techniques. It can convert segmented volumetric brain scans into multilayered surfaces and tetrahedral mesh models, with typical processing times of only a few minutes and broad utilities, such as in Monte Carlo or finite-element-based photon simulations for fNIRS studies. Results: A variety of high-quality brain mesh models have been successfully generated by processing publicly available brain atlases. In addition, we compare three brain anatomical models-the voxel-based brain segmentation, tetrahedral brain mesh, and layered-slab brain model-and demonstrate noticeable discrepancies in brain partial pathlengths when using approximated brain anatomies, ranging between - 1.5 % to 23% with the voxelated brain and 36% to 166% with the layered-slab brain. Conclusion: The generation and utility of high-quality brain meshes can lead to more accurate brain quantification in fNIRS studies. Our open-source meshing toolboxes "Brain2Mesh" and "Iso2Mesh" are freely available at http://mcx.space/brain2mesh.

Keywords: Monte Carlo method; brain atlas; functional near-infrared spectroscopy; tetrahedral mesh generation.


Figures

Fig. 1
Fig. 1
Segmentation pathways from anatomical head and brain MRI scans. The common neuroimaging tools/extensions (left) and the corresponding outputs (right, shaded) are listed.
Fig. 2
Fig. 2
Illustration of the layered tissue model and the segmentation preprocessing workflow. Multiple air cavities are allowed. An arrow represents a thinning (T) or thickening (T+) operation between two adjacent regions. Two sample pathways are indicated, shown by black and blue arrows, respectively. The circled numbers indicate the processing order. The gaps inserted between layers can be removed in the postprocessing step to recover shared boundaries (such as the CSF/GM/WM surfaces here).
Fig. 3
Fig. 3
Processing steps for a surface-based mesh generation workflow. The left side shows the steps for processing tissue probability maps and multilabel volumes, and the right side shows additional steps to incorporate precreated pial and WM surfaces. The specific algorithm used in each step is indicated in red, and dashed boxes and arrows indicate optional processing steps.
Fig. 4
Fig. 4
A five-layered full head tetrahedral mesh derived from an atlas head of the USC 40 to 44 atlas. It contains (a) WM, (b) GM, (c) CSF, (d) skull, and (e) scalp layers. (f) A cross-cut view of the tetrahedral mesh is shown.
Fig. 5
Fig. 5
Comparison between (a)–(c) conventional CGAL-based volumetric meshing and (d)–(f) the new surface-based meshing approaches. From left to right, we show sample meshes for (a), (d) GM; (b), (e) CSF; and (c), (f) WM/scalp.
Fig. 6
Fig. 6
Demonstration of mesh density control. (a) The mesh contains 181,026 nodes, 1,060,051 elements, with a runtime of 53.47 s. (b) The mesh includes 499,134 nodes, 3,009,706 elements, with runtime 76.03 s, and (c) the mesh has 1,023,739 nodes, 6,220,187 elements, and 135 s runtime. The five layers of brain tissues are, in order from outer to inner: scalp (apricot), skull (light-yellow), CSF (blue), GM (gray), and WM (white).
Fig. 7
Fig. 7
Box plots of surface errors as a function of resampling ratio (percentage of edges that are preserved) when downsampling a FreeSurfer-generated pial surface. Spatial distributions of the errors are shown as insets.
Fig. 8
Fig. 8
Tetrahedral mesh generated from a hybrid meshing pathway combining FreeSurfer surfaces with SPM segmentation outputs for the USC 30 to 34 atlas. The (a) sagittal and (b) coronal views are shown. The tissue layers include scalp (apricot), skull (light-yellow), CSF (blue), GM (gray), and WM (white).
Fig. 9
Fig. 9
Illustrative brain mesh examples (coronal views) produced using the Neurodevelopmental MRI Database, including (a) 16 years, (b) 17.5 years, (c) 25 to 29 years, (d) 30 to 34 years, (e) 35 to 39 years, (f) 40 to 44 years, (g) 50 to 54 years, (h) 60 to 64 years, and (i) 70 to 74 years old. The tissue layers include scalp (apricot), skull (light-yellow), CSF (blue), GM (gray), and WM (white).
Fig. 10
Fig. 10
Comparisons of fluence distributions in an MRI brain atlas (19.5 years) using three different brain models: (a) MC fluence maps using anatomically derived mesh (computed using DMMC) and voxel (computed using MCX) brain representations, and (b) fluence maps computed using the MC and DA in a simple layered-slab brain model. Contour plots, in log-10 scale, are shown along the coronal planes with each brain tissue layer labeled and delineated by black dashed lines. In (a), the “L” and “R” markings (red) indicate the left brain and the right brain, respectively. The comparisons between the mesh and voxel tissue boundaries are shown in the inset of (a).

References

    1. Ferrari M., Quaresima V., “A brief review on the history of human functional near-infrared spectroscopy (fNIRS) development and fields of application,” NeuroImage 63, 921–935 (2012).NEIMEF10.1016/j.neuroimage.2012.03.049 - DOI - PubMed
    1. Pucci O., Toronov V., Lawrence K. S., “Measurement of the optical properties of a two-layer model of the human head using broadband near-infrared spectroscopy,” Appl. Opt. 49, 6324–6332 (2010).APOPAI10.1364/AO.49.006324 - DOI - PubMed
    1. Selb J., et al. , “Comparison of a layered slab and an atlas head model for Monte Carlo fitting of time-domain near-infrared spectroscopy data of the adult head,” J. Biomed. Opt. 19, 016010 (2014).JBOPFO10.1117/1.JBO.19.1.016010 - DOI - PMC - PubMed
    1. Shang Y., Yu G., “A Nth-order linear algorithm for extracting diffuse correlation spectroscopy blood flow indices in heterogeneous tissues,” Appl. Phys. Lett. 105, 133702 (2014).APPLAB10.1063/1.4896992 - DOI - PMC - PubMed
    1. Eggebrecht A. T., et al. , “Mapping distributed brain function and networks with diffuse optical tomography,” Nat. Photonics 8, 448–454 (2014).NPAHBY10.1038/nphoton.2014.107 - DOI - PMC - PubMed