

Breeze: an integrated quality control and data analysis application for high-throughput drug screening
- PMID: 32119072
- PMCID: PMC7267830
- DOI: 10.1093/bioinformatics/btaa138
Breeze: an integrated quality control and data analysis application for high-throughput drug screening
Abstract
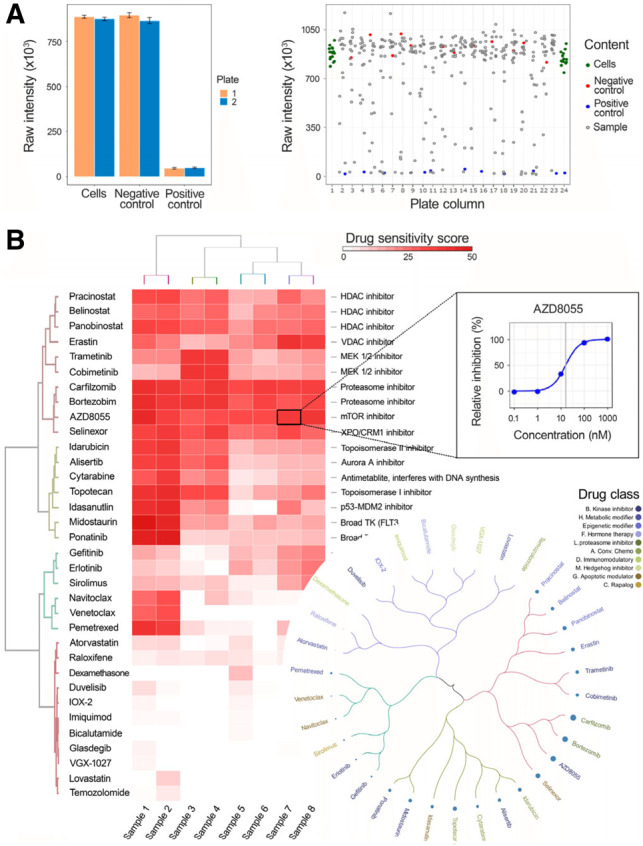
Summary: High-throughput screening (HTS) enables systematic testing of thousands of chemical compounds for potential use as investigational and therapeutic agents. HTS experiments are often conducted in multi-well plates that inherently bear technical and experimental sources of error. Thus, HTS data processing requires the use of robust quality control procedures before analysis and interpretation. Here, we have implemented an open-source analysis application, Breeze, an integrated quality control and data analysis application for HTS data. Furthermore, Breeze enables a reliable way to identify individual drug sensitivity and resistance patterns in cell lines or patient-derived samples for functional precision medicine applications. The Breeze application provides a complete solution for data quality assessment, dose-response curve fitting and quantification of the drug responses along with interactive visualization of the results.
Availability and implementation: The Breeze application with video tutorial and technical documentation is accessible at https://breeze.fimm.fi; the R source code is publicly available at https://github.com/potdarswapnil/Breeze under GNU General Public License v3.0.
Contact: swapnil.potdar@helsinki.fi.
Supplementary information: Supplementary data are available at Bioinformatics online.
© The Author(s) 2020. Published by Oxford University Press.
Figures
References
Publication types
MeSH terms
LinkOut - more resources
Full Text Sources
Other Literature Sources
