

Association of Formulary Exclusions and Restrictions for Opioid Alternatives With Opioid Prescribing Among Medicare Beneficiaries
- PMID: 32119095
- PMCID: PMC7052746
- DOI: 10.1001/jamanetworkopen.2020.0274
Association of Formulary Exclusions and Restrictions for Opioid Alternatives With Opioid Prescribing Among Medicare Beneficiaries
Abstract
Importance: Although there are many pharmacologic alternatives to opioids, it is unclear whether the structure of Medicare Part D formularies discourages use of the alternatives.
Objectives: To quantify the coverage of opioid alternatives and prevalence of prior authorization, step therapy, quantity limits, and tier placement for these drugs, and test whether these formulary exclusions and restrictions are associated with increased opioid prescribing to older adults at the county level.
Design, setting, and participants: County fixed-effect models were estimated using a panel of counties across the 50 US states and the District of Columbia over calendar years 2015 and 2016. Data analysis was conducted from July 1 to September 23, 2019. The sample included 2721 counties in 2015 and 2671 counties in 2016 with sufficient data on Medicare Part D formulary design and opioid prescribing.
Main outcomes and measures: County-level opioid prescribing rate (number of opioid claims divided by the number of overall claims) and counts of excluded opioid alternatives and opioid alternatives with prior authorization, step therapy, quantity limits, and high-tier placements.
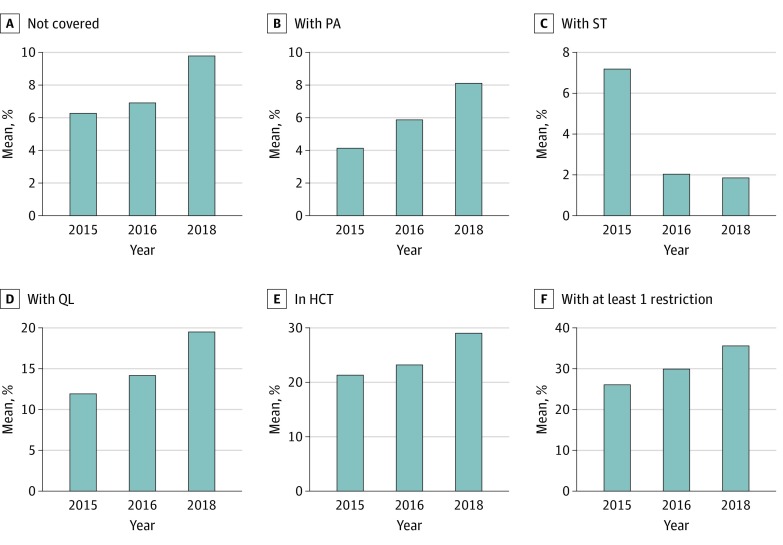
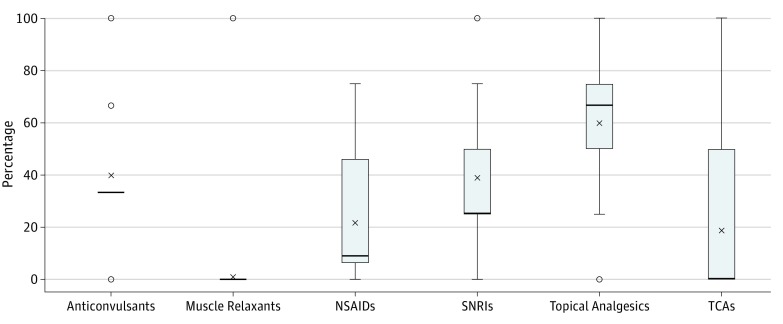
Results: A total of 30 nonopioid analgesics were examined across 28 997 Medicare plans in 2015 and 30 390 plans in 2016. Medicare plans did not cover a mean of 7% of these drugs (interquartile range, 10%; lower to upper limit, 0%-23%). Among covered nonopioids, prior authorization and step therapy were uncommon, with fewer than 5% affected by prior authorization and 0% by step therapy. However, 13% of covered nonopioids had quantity limits (interquartile range, 10%; lower to upper limit, 0%-31%) and 22% were in high-cost tiers (interquartile range, 38%; lower to upper limit, 0%-50%). Increases in the number of nonopioids excluded on Medicare plans in a county were associated with increased opioid prescribing (effect size relative to mean, 2.2%-3.7%; P = .004). Conversely, increases in the number of opioids not covered on Medicare plans in a county was found to be associated with decreased opioid prescribing (effect size relative to mean, 0.8%-1.5%; P = .02). None of the utilization management strategies (prior authorization, step therapy, and quantity limits) examined or high-cost tier placements of nonopioids were associated with increased opioid prescribing.
Conclusions and relevance: Lack of Medicare coverage for pharmacologic alternatives to opioids may be associated with increased opioid prescribing.
Conflict of interest statement
Figures

References
-
- Centers for Disease Control and Prevention . US Opioid prescribing rate maps. https://www.cdc.gov/drugoverdose/maps/rxrate-maps.html. Published 2017. Accessed July 1, 2019.
-
- US Department of Health & Human Service, Office of Inspector General . Opioid use in Medicare Part D remains concerning. https://oig.hhs.gov/oei/reports/oei-02-18-00220.pdf. Published June 2018. Accessed January 25, 2020.
Publication types
MeSH terms
Substances
LinkOut - more resources
Full Text Sources
Medical
