. 2020 Aug;42(8):2039-2049.
doi: 10.1002/hed.26125. Epub 2020 Mar 2.

Assessment of surgical tumor-free resection margins in fresh squamous-cell carcinoma resection specimens of the tongue using a clinical MRI system

Affiliations

Assessment of surgical tumor-free resection margins in fresh squamous-cell carcinoma resection specimens of the tongue using a clinical MRI system

Jan Heidkamp et al. Head Neck. 2020 Aug.

Abstract

Background: Current intraoperative methods of visual inspection and tissue palpation by the surgeon, and frozen section analysis cannot reliably prevent inadequate surgical margins in patients treated for oral squamous-cell carcinoma (OSCC). This study assessed feasibility of MRI for the assessment of surgical resection margins in fresh OSCC specimens.

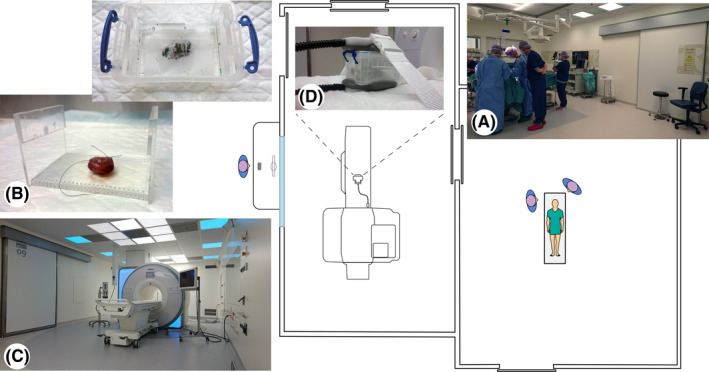
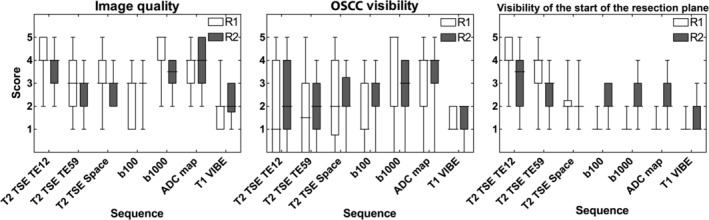
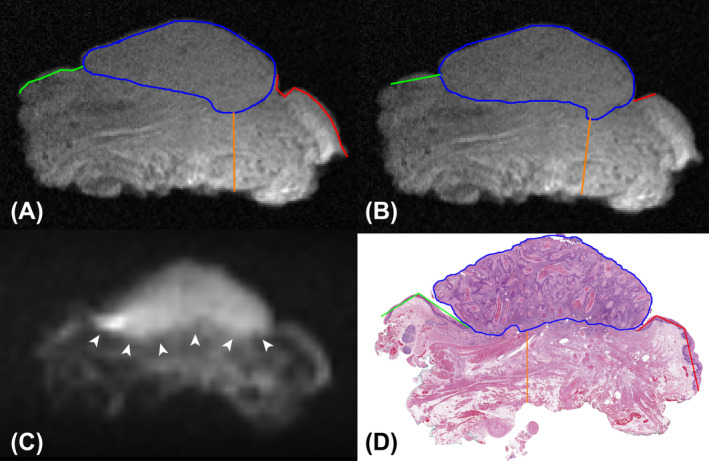
Methods: Ten consecutive tongue specimens containing OSCC were scanned using 3 T clinical whole-body MRI. Two radiologists independently annotated OSCC location and minimal tumor-free margins. Whole-mount histology was the reference standard.

Results: The positive predictive values (PPV) and negative predictive values (NPV) for OSCC localization were 96% and 75%, and 87% and 79% for reader 1 and 2, respectively. The PPV and NPV for identification of margins <5 mm were 38% and 91%, and 5% and 87% for reader 1 and 2, respectively.

Conclusions: MRI accurately localized OSCC with high inter-reader agreement in fresh OSCC specimens, but it seemed not yet feasible to accurately assess the surgical margin status.

Keywords: MRI; margins of excision; squamous cell carcinoma of head and neck; tongue neoplasms; whole mount histology.


Figures

Figure 1
Figure 1
Preparation of the surgical specimen for MRI acquisition. A, Partial tongue resection is performed in the operation room adjacent to the MRI room. B, The fresh tongue resection specimen is transported to the pathology minilab where it was inked and positioned on an in‐house Perpex container (left inset). The specimen was pinned down to the bottom of the container using a gauze pad and submersed in perfluoropolether (right inset). C, The 3 T clinical MRI system within the operating room suite. D, The container holding the specimen positioned on the MRI table showing the bilateral four‐channel phased array surface carotid coil positioned underneath and on top of the container [Color figure can be viewed at wileyonlinelibrary.com]
Figure 2
Figure 2
Results of qualitative image evaluation represented in box‐whisker plots for readers R1 (nonfilled boxes) and R2 (gray filled boxes), with the results for Image quality, OSCC visibility, and Visibility of the start of the resection plane. The box plots demonstrate the median score (bold horizontal lines), interquartile range (boxes), and extreme values (whiskers). OSCC, oral squamous‐cell carcinoma
Figure 3
Figure 3
Median and individual (n = 7) T1, T2, and ADC values for OSCC and healthy tongue tissue. ADC, apparent diffusion coefficient; OSCC, oral squamous‐cell carcinoma
Figure 4
Figure 4
Example of MR images and corresponding histological slide obtained from a tongue resection specimen from an 86‐year‐old female patient. Blue lines, annotations of OSCC; green, 9‐o'clock margin; orange, deep margin; red, 3‐o'clock margin. The DSC between the annotated OSCC areas on MRI was 0.87 for this case. A, Annotation by reader 1 of MR image obtained with a T2W TSE sequence. OSCC area = 107 mm2; 9‐o'clock margin = 11.6 mm; deep margin = 5.7 mm; 3‐o'clock margin = 10.7 mm. B, Annotation by reader 2 of identical MR image as (A). OSCC area = 114 mm2; 9‐o'clock margin = 5.5 mm; deep margin = 6.2 mm; 3‐o'clock margin = 10.5 mm. At 9‐o'clock side, the OSCC area appears overestimated resulting in underestimation of the 9‐o'clock margin. C, Corresponding diffusion weighted b1000 image showing diffusion restriction (black arrowheads). D, Corresponding hematoxylin and eosin stained histological slide at ×100 magnification confirmed a pT3 OSCC. OSCC area = 79 mm2; 9‐o'clock margin = 8.4 mm; deep margin = 6.1 mm; 3‐o'clock margin = 9.4 mm. DSC, Dice similarity coefficient; OSCC, oral squamous‐cell carcinoma; TSE, turbo spin echo [Color figure can be viewed at wileyonlinelibrary.com]
Figure 5
Figure 5
Example of MR images and corresponding histological slide obtained from a tongue resection specimen from an 82‐year‐old male patient. Blue lines, annotations of OSCC; green, 9‐o'clock margin; orange, deep margin; red, 3‐o'clock margin. The DSC between the annotated OSCC areas on MRI was 0.92 in this case. Note that on the histological slide a sulcus is present on both sides of the exofytically growing tumor that are not visible on MRI. A, Annotation by reader 1 of MR image obtained with a T2W TSE sequence. OSCC area = 95 mm2; 9‐o'clock margin = 6.6 mm; deep margin = 7.3 mm; 3‐o'clock margin = 11.3 mm. B, Annotation by reader 2 of identical MR image as (A). OSCC area = 105 mm2; 9‐o'clock margin = 4.6 mm; deep margin = 7.0 mm; 3‐o'clock margin = 4.6 mm. Both the 9‐ o'clock and 3‐o'clock margins were false positively evaluated as less than 5 mm which was probably caused by difficulties in determining the point where the healthy mucosa ends and where the resection plane start. C, Corresponding diffusion weighted b1000 image showing diffusion restriction (white arrowheads). D, Corresponding hematoxylin and eosin stained histological slide at ×100 magnification confirmed a pT2 OSCC. OSCC area = 114 mm2; 9‐o'clock = 9.3 mm; deep margin = 6.4 mm; 3‐o'clock margin = 10.6 mm. DSC, Dice similarity coefficient; OSCC, oral squamous‐cell carcinoma; TSE, turbo spin echo [Color figure can be viewed at wileyonlinelibrary.com]

Similar articles

Cited by

References

    1. Siegel RL, Miller KD, Jemal A. Cancer statistics, 2018. CA Cancer J Clin. 2018;68(1):7‐30. - PubMed
    1. Bell RB, Kademani D, Homer L, Dierks EJ, Potter BE. Tongue cancer: is there a difference in survival compared with other subsites in the oral cavity? J Oral Maxillofac Surg. 2007;65(2):229‐236. - PubMed
    1. Yao M, Epstein JB, Modi BJ, Pytynia KB, Mundt AJ, Feldman LE. Current surgical treatment of squamous cell carcinoma of the head and neck. Oral Oncol. 2007;43(3):213‐223. - PubMed
    1. National Comprehensive Cancer Network. NCCN Clinical Practice Guidelines in Oncology, Head and Neck Cancer, Version 2.2013 [Internet]. https://www.nccn.org/professionals/physician_gls/pdf/head-and-neck.pdf. Accessed May 8, 2018.
    1. Slootweg PJ, Hordijk GJ, Schade Y, van Es RJJ, Koole R. Treatment failure and margin status in head and neck cancer. A critical view on the potential value of molecular pathology. Oral Oncol. 2002;38(5):500‐503. - PubMed