. 2020 May 21:493:110193.
doi: 10.1016/j.jtbi.2020.110193. Epub 2020 Feb 28.

A modeling platform for the lymphatic system

Affiliations

A modeling platform for the lymphatic system

Javier Ruiz-Ramírez et al. J Theor Biol. .

Abstract

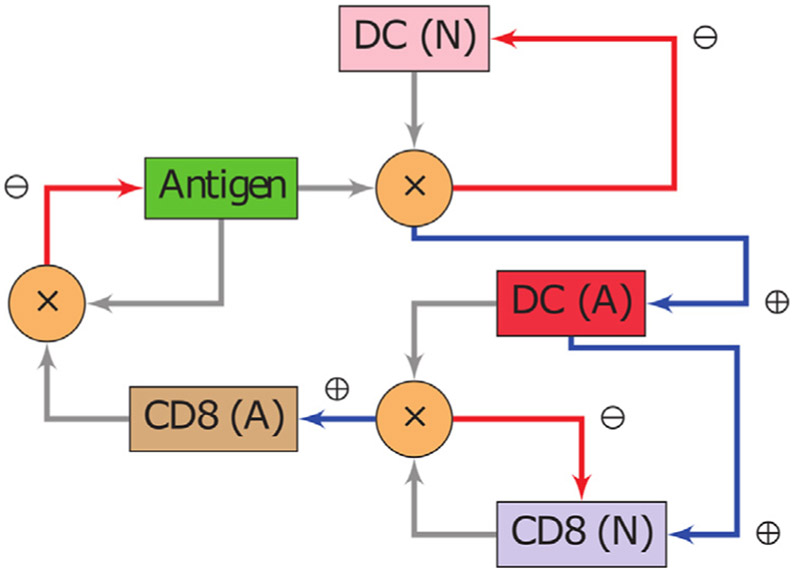
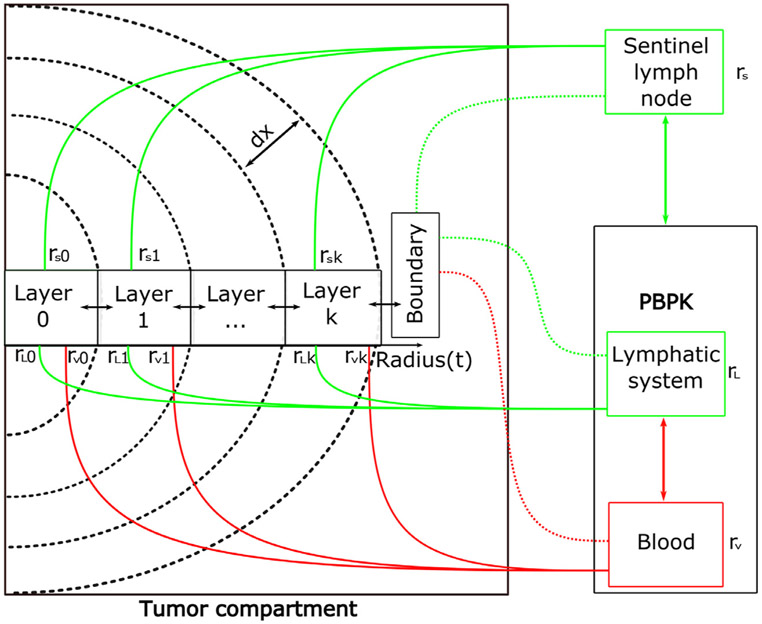
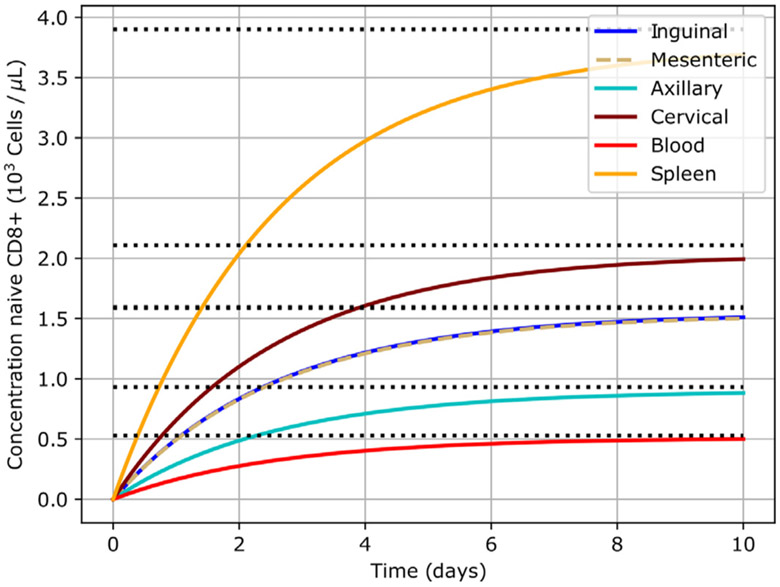
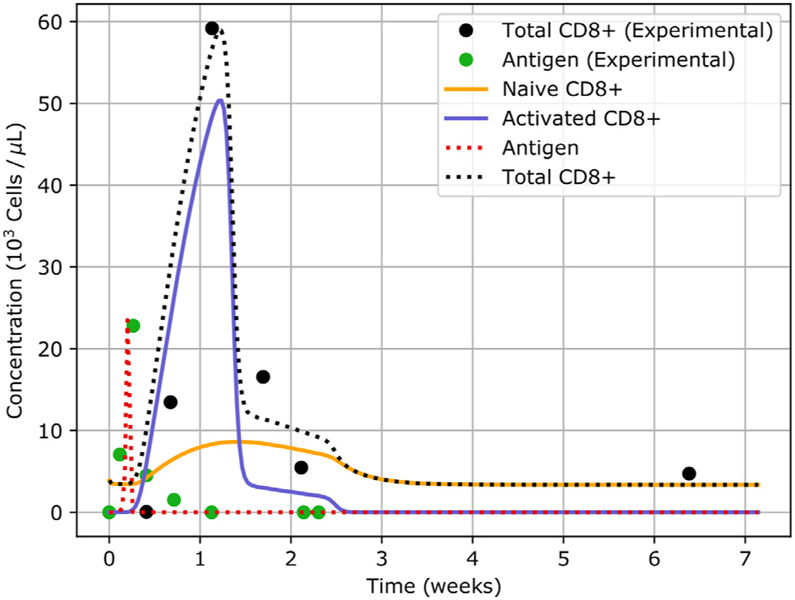
We present a physiologically-based pharmacokinetic modeling platform capable of simulating the biodistribution of different therapeutic agents, including cells, their interactions within the immune system, redistribution across lymphoid compartments, and infiltration into tumor tissues. This transport-based platform comprises a distinctive implementation of a tumor compartment with spatial heterogeneity which enables the modeling of tumors of different size, necrotic state, and agent infiltration capacity. We provide three validating and three exploratory examples that illustrate the capabilities of the proposed approach. The results show that the model can recapitulate immune cell balance across different compartments, respond to antigen stimulation, simulate immune vaccine effects, and immune cell infiltration to tumors. Based on the results, the model can be used to study problems pertinent to current immunotherapies and has the potential to assist medical techniques that rely on the transport of biological species.

Keywords: Cancer; Immunotherapy; Lymphatic system; Mathematical modeling; Physiologically-based pharmacokinetic modeling.


Figures

Fig. 1.
Fig. 1.
Depiction of the fundamental structures of the L-PBPK. A: Graphical depiction of the grouping of LNs in the mouse model and the corresponding connectivity. An injection site located at the left hind footpad has been included to indicate the possibility of modeling the delivery of a biological agent at a specific location. B: Simplified diagram of the network of compartments in the mouse model.
Fig. 2.
Fig. 2.
Interactions between cell populations and antigen. Depiction of an immunological response between an antigen, DCs and CD8s. The notation (N) indicates a naive population, whereas (A) represents an activated state. Whenever two arrows meet at a node marked with a ( × ), the product of the populations of the involved species is to be interpreted. The blue arrows (⊕) denote a positive impact (increase) in the cell population to which they point. Red arrows (⊖) indicate the opposite effect. Note that the system is closed and hence all cell populations and antigen affect each other.
Fig. 3.
Fig. 3.
Internal structure of the tumor compartment. The tumor compartment is divided into layers, each of thickness dx which is itself a compartment with individual reaction and transport properties. To simulate tissue heterogeneity, parameters such as the vascular and lymphatic volumetric fraction, rV and rL, respectively, can be chosen in each layer. Moreover, the tumor object also allows the possibility of being connected to adjacent LNs to simulate the presence of sentinel LNs. The last layer designated as the boundary can also be separately manipulated to account for transport differences at the (well-perfused) tumor tissue interface.
Fig. 4.
Fig. 4.
L-PBPK evolves towards equilibrium. The system starts from a fully depleted state (zero cells) and progressively approaches equilibrium. The equilibrium states in different compartments are represented by the black dotted lines.
Fig. 5.
Fig. 5.
Simulation of a CD8-meditated immune response. Plot of the concentration of different biological species in the spleen. The black dotted line denotes the total population of CD8s. The naive population of CD8s is depicted in orange, while the activated is shown in blue. The red dotted line indicates the concentration of antigen. The solid dots represent the experimental values.
Fig. 6.
Fig. 6.
Temporal evolution of the concentration of CD8A in the spleen and the tumor. The black dashed curve corresponds to the case where the vasculature fraction is constant. The purple dashed curve also indicates the concentration of CD8A in tumor, but employing the sigmoidal profile given in panel A of Figure S3 for the vascular fraction. The modifier ( × 30) is used to denote an amplification factor of 30, i.e., the concentration data was multiplied by 30. This is done to facilitate the comparison using similar scales. B: Concentration of CD8A inside each layer of the tumor compartment for the case of a heterogeneous vascular fraction profile (see panel B of Figure S3).
Fig. 7.
Fig. 7.
PET of CD8s in the spleen as a function of the expansion factor. Plot of the PET T95 (CD8)Spleen as a function of the expansion factor M. The model is of the form T95(M) = a · eb·M with a coefficient of determination R2 ≈ 0.997, a^ = 4.2, b^ = 1.37, and standard errors s(a^) = 0.41, s(b^) = 0.04.

Similar articles

Cited by

References

    1. Alitalo A, Detmar M, 2012. Interaction of tumor cells and lymphatic vessels in cancer progression. Oncogene 31 (42), 4499–4508. - PubMed
    1. Baba M, Tatsuta M, Miya A, Ishida H, Masutani S, Kawasaki T, Satomi T, Hanai J, Kimura F, 2000. A case of breast cancer diagnosed by inguinal lymph node metastasis. Breast Cancer 7 (2), 173–175. - PubMed
    1. Bird R, Stewart W, Lightfoot E, 2002. Transport Phenomena. John Wiley & Sons.
    1. Boswell CA, Ferl GZ, Mundo EE, Bumbaca D, Schweiger MG, Theil F-P, Fielder PJ, Khawli LA, 2011. Effects of anti-VEGF on predicted antibody biodistribution: roles of vascular volume, interstitial volume, and blood flow. PLoS One 6 (3), e17874. - PMC - PubMed
    1. Braun M, Golubitsky M, 1983. Differential Equations and Their Applications, 4 Springer.

Publication types