. 2020 Jun:213:116685.
doi: 10.1016/j.neuroimage.2020.116685. Epub 2020 Feb 28.

All-or-none face categorization in the human brain

Affiliations

All-or-none face categorization in the human brain

Talia L Retter et al. Neuroimage. 2020 Jun.

Abstract

Visual categorization is integral for our interaction with the natural environment. In this process, similar selective responses are produced to a class of variable visual inputs. Whether categorization is supported by partial (graded) or absolute (all-or-none) neural responses in high-level human brain regions is largely unknown. We address this issue with a novel frequency-sweep paradigm probing the evolution of face categorization responses between the minimal and optimal stimulus presentation times. In a first experiment, natural images of variable non-face objects were progressively swept from 120 to 3 ​Hz (8.33-333 ​ms duration) in rapid serial visual presentation sequences. Widely variable face exemplars appeared every 1 ​s, enabling an implicit frequency-tagged face-categorization electroencephalographic (EEG) response at 1 ​Hz. Face-categorization activity emerged with stimulus durations as brief as 17 ​ms (17-83 ​ms across individual participants) but was significant with 33 ​ms durations at the group level. The face categorization response amplitude increased until 83 ​ms stimulus duration (12 ​Hz), implying graded categorization responses. In a second EEG experiment, faces appeared non-periodically throughout such sequences at fixed presentation rates, while participants explicitly categorized faces. A strong correlation between response amplitude and behavioral accuracy across frequency rates suggested that dilution from missed categorizations, rather than a decreased response to each face stimulus, accounted for the graded categorization responses as found in Experiment 1. This was supported by (1) the absence of neural responses to faces that participants failed to categorize explicitly in Experiment 2 and (2) equivalent amplitudes and spatio-temporal signatures of neural responses to behaviorally categorized faces across presentation rates. Overall, these observations provide original evidence that high-level visual categorization of faces, starting at about 100 ​ms following stimulus onset in the human brain, is variable across observers tested under tight temporal constraints, but occurs in an all-or-none fashion.


Figures

Figure 1.
Figure 1.
An overview of the experimental design across Experiments 1 and 2.
Figure 2.
Figure 2.
Face-categorization responses characterized in the frequency domain across conditions (Experiment 1), in the form of baseline-subtracted amplitude spectra. Face-selective responses were tagged at F (= 1 Hz) in every condition, with higher harmonics occurring at 2F (2 Hz), 3F (3 Hz), etc. (only the first two harmonics are labeled above the spectra). The data are shown over the region of the scalp failateral occipito-temporal ROI) andfrequency range (up to 20 Hz) that were selected to capture face-selective responses. Higher harmonio frequencies coinciding with stimulus-presentation harmonio frequencies are drawn in very light yellow, and may surpass the plotted amplitude range. For ease of comparison across conditions, all graphs are plotted with common axes.
Figure 3.
Figure 3.
Face-categorization responses as a function of stimulus presentation rate. A) The number of participants (out of 16 in total; Experiment 1) with significant EEG responses at each stimulus presentation rate (Z > 1.64; p< .05). Group-level significance first emerged at 30 Hz over the occipito-temporal ROI (p = .0002). B) The number of participants with more behavioral categorization hits than false alarms (Experiment 2). Group-level significance first emerged at 60 Hz (p = .015). Key) avgOT = average across the left andright occipito-temporal ROIs; avg128 = average of all 128 EEG channels.
Figure 4.
Figure 4.
A) Neural face-categorization responses (baseline-subtracted, summed-harmonic amplitudes) as a function of stimulus-presentation rate (Experiment 1). B) Scalp topographies (top row: amplitudes; bottom row: normalized amplitudes). C) The bilateral occipito-temporal (OT) and the medial occipital (MO) ROIs for face-categorization responses. Key) LOT: left occipito-temporal ROI; ROT: right occipito-temporal ROI; avgOT = average of these left and right occipito-temporal ROIs; avg128 = average of all 128 EEG channels.
Figure 5.
Figure 5.
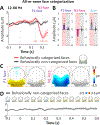
Time-domain responses (N = 16) across 12–60 Hz to all behaviorally categorized faces (Experiment 2). A) Waveforms over the occipito-temporal ROI, to behaviorally categorized (in red) and non-categorized (in black) faces. Significant time points (p<.001) are indicated below for categorized faces (in red) and non-categorized faces (none). Shading indicates ± one standard error of the mean. B) The amplitude at the selective P1-face and N1-face components, as defined in Experiment 1 (see Figure 6A), as well as their sum, at the occipito-temporal ROI. Group-average data is plotted in bar graphs, with error bars of ± one standard error of the mean, and individual participant data is plotted in gray dots. Summed responses to behaviorally categorized faces (red highlight) are significantly different from zero at the group-level, while those to faces that were not categorized (black highlight) are not significant. C) Posterior topographies at the peak times of the P1-face and N1-face, for behaviorally categorized (red outline) and non-categorized (black outline) faces. Component times, taken from Experiment 1, are indicated in Panel A. D) Responses to non-categorized faces are absent over a longer time window (no significant time points). Topographies above the occipito-temporal waveform are sampled every 50 ms from 100 ms prior to stimulus onset.
Figure 6.
Figure 6.
Behavioral face-categorization accuracy (Experiment 2) compared with neural face-categorization response amplitude (Experiment 1). A) Baseline-subtracted summed-harmonic amplitudes over the OT (avgOT) ROI are plotted (left y-axis scale) along with behavioral accuracy (right y-axis scale). B) A linear relationship between accuracy (Experiment 2) and amplitude (Experiment 1) between 12 and 60 Hz. The data points from the remaining presentation rates (3, 6, and 120 Hz) are shown in light gray, but were not included in this correlation.
Figure 7.
Figure 7.
Time-domain responses from Experiment 2 to behaviorally categorized and non-categorized faces together (blue), compared to categorized faces alone (red). There were fewer categorized faces at the higher (24 and 30 Hz), relative to lower (12 and 20 Hz) frequencies; results are shown for participants who had a minimum of 20 artifact-free face-categorizations at both frequency pairs (N = 9). A) Waveforms of the bilateral OT ROI for 12 and 20 Hz (left), and 24 and 30 Hz (right), for both behaviorally categorized faces only (red) and behaviorally categorized and non-categorized faces combined (blue). The indicated times of the P1-face (144 ms) and N1-face (202 ms) components are taken from Experiment 1 (see Figure 6A). B) Scalp topographies of these two components; outlines indicating condition are colored as in the previous panels. C) The combined amplitude of the P1-face and N1-face components, at the OT ROI. Responses to behaviorally categorized faces alone did not differ across these conditions (left), but responses to behaviorally categorized and non-categorized faces together were significantly larger at 12 and 20 Hz than at 24 and 30 Hz (right). D) The percent accuracy dropped from 12 and 20 Hz to 24 and 30 Hz by about 32%; note the correspondence with the 31% decreased EEG amplitude across these conditions in Panel C for to behaviorally categorized and non-categorized faces.
Figure 8.
Figure 8.
Time-domain responses to face presentation from Experiment 1, with each frequency condition filtered to remove the response at its respective stimulus-presentation frequency. Four components were present repeatedly across conditions: P1-face, N1-face, P2-face, and P3-face, and are indicated by a vertical line showing the average peak time, and shading depicting the range, across significant conditions. A) Waveforms of the bilateral OT ROI in response to face stimulus onset (0 s). For each condition, significant time periods (p<.001) are plotted in red, while those insignificant are plotted in black. B) Scalp topographies, plotted from 0.1–0.6 s post-stimulus onset, every 0.05 s. Significant response periods are underlined in the color of their respective component for each condition; significant periods not corresponding to one of these four components are indicated in gray. C) An average of all conditions with significant face-categorization responses in the frequency domain. The bilateral occipito-temporal ROI is plotted in thick black, superimposed above the data from all 128 EEG channels, colored accordingly to the adjacent 2D scalp topography (F: frontal; R: right; O: occipital; L: left). The topographies are plotted to the right at the peaks of the P1-face (142 ms), N1-face (202 ms), P2-face (286 ms), and P3-face (519 ms) for this waveform.
Figure 9.
Figure 9.
Individual differences in behavioral performance (Experiment 2) related to EEG amplitude (at the OT ROI; Experiment 1) for face categorization. A) Presentation rates diagnostic of individual differences. A comparison of the participant with the best vs. worst behavioral (inverse efficiency; IE) responses across presentation rates. The highlighted sections indicate data ranges used in panels C and D. Above: Accuracy; Below: Summed baseline-subtracted harmonic amplitude over the bilateral OT ROI. B) As in Part A, except the 16 participants were split into quartiles of four participants each, ranked 1st–4th behaviorally (Group 1), 5th–8th (Group 2), 9th–12th (Group 3), and 13th–16th (Group 4). C) The non-significant correlation of individuals’ IE (across all presentation rates) with their OT ROI EEG amplitudes at 3 Hz (highlighted in blue in the previous two panels). D) The significant correlation between individuals’ IE with their mid-frequency OT EEG amplitudes (averaged over 20, 24, and 30 Hz, highlighted in orange in the previous two panels), weighted by the amplitude at 3 Hz. In both panels C and D, the data from the participants yielding the best and worst behavioral performance are labeled, respectively.

Similar articles

Cited by

References

    1. Adrian ED, Matthews BHC (1934). The Berger rhythm: Potential changes from the occipital lobes in man. Brain, 4 (57), 355–385. - PubMed
    1. Allison T, Ginter H, McCarthy G, Nobre AC, Puce A, Luby M & Spencer DD (1994). Face recognition in human extrastriate cortex. Journal of Neurophysiology, 71(2), 821–825. - PubMed
    1. Bachman T (2013). On the all-or-none rule of conscious perception. Frontiers in Human Neuroscience, 7, 387. - PMC - PubMed
    1. Bacon-Macé N, Macé MJ, Fabre-Thorpe M & Thorpe SJ (2005). The time course of visual processing: backward masking and natural scene categorisation. Vision Research, 45(11), 1459–1469. - PubMed
    1. Bar M, Tootell RBH, Schacter DL, Greve DN, Fischl B, Mendola JD, Rosen BR & Dale AM (2001). Cortical mechanisms specific to explicit visual object recognition. Neuron, 29(2), 529–535. - PubMed

Publication types