. 2020 Feb 27;10(3):82.
doi: 10.3390/metabo10030082.

Improved Dried Blood Spot-Based Metabolomics: A Targeted, Broad-Spectrum, Single-Injection Method

Affiliations

Improved Dried Blood Spot-Based Metabolomics: A Targeted, Broad-Spectrum, Single-Injection Method

Kefeng Li et al. Metabolites. .

Abstract

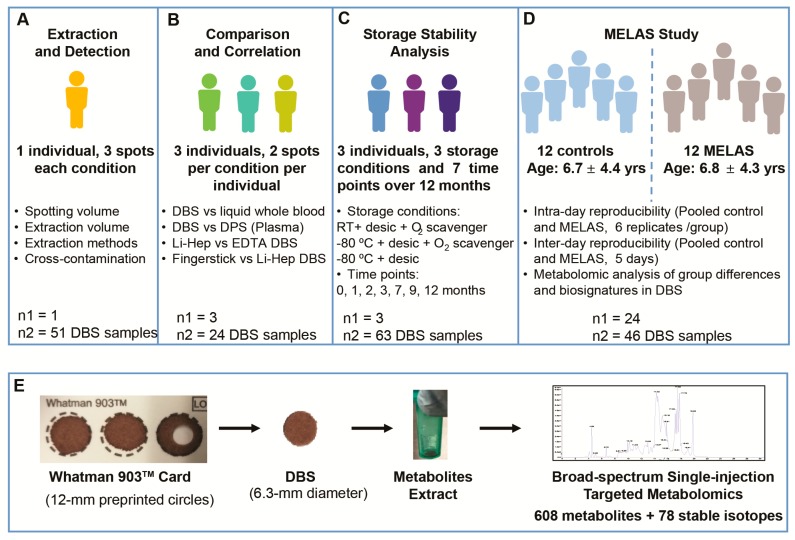
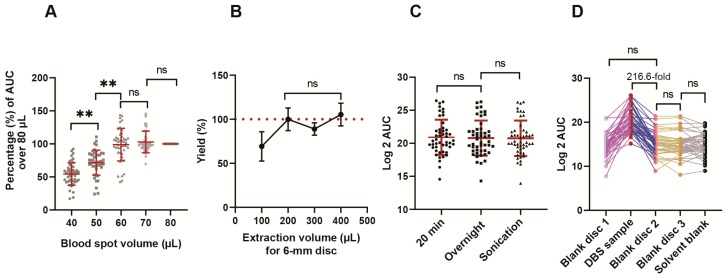
Dried blood spots (DBS) have proven to be a powerful sampling and storage method for newborn screening and many other applications. However, DBS methods have not yet been optimized for broad-spectrum targeted metabolomic analysis. In this study, we developed a robust, DBS-based, broad-spectrum, targeted metabolomic method that was able to measure over 400 metabolites from a 6.3 mm punch from standard Whatman 903TM filter paper cards. The effects of blood spot volumes, hematocrit, vacutainer chemistry, extraction methods, carryover, and comparability with plasma and fingerstick capillary blood samples were analyzed. The stability of over 400 metabolites stored under varying conditions over one year was also tested. No significant impacts of blood volume and hematocrit variations were observed when the spotted blood volume was over 60 µL and the hematocrit was between 31% and 50%. The median area under the curve (AUC) of metabolites in the DBS metabolome declined by 40% in the first 3 months and then did not decline further for at least 1 year. All originally detectable metabolites remained within detectable limits. The optimal storage conditions for metabolomic analysis were -80 °C with desiccants and without an O2 scavenger. The method was clinically validated for its potential utility in the diagnosis of the mitochondrial disease mitochondrial encephalomyopathy, lactic acidosis, and stroke-like episodes (MELAS). Our method provides a convenient alternative to freezing, storing, and shipping liquid blood samples for comparative metabolomic studies.

Keywords: MELAS; broad-Spectrum; dried blood spots; metabolomics; targeted.


Conflict of interest statement

The authors declare no conflict of interest. The funders had no role in the design of the study; in the collection, analyses, or interpretation of data; in the writing of the manuscript, or in the decision to publish the results.

Figures

Figure 1
Figure 1
Overview of the study design and clinical cohorts. (A) Extraction and carryover. (B) Sample types. (C) Storage stability. (D) MELAS study. (E) DBS extraction and analysis.
Figure 2
Figure 2
Dried blood spot (DBS) workflow optimization. (A) The effect of blood spot volumes. (B) The effect of the volumes of the extraction buffer. (C) The different extraction methods. (D) The effect of cross-contamination between punches. A total of 47 representative metabolites covering the whole gradient were selected for the analysis. Data were mean ± SD. One-way ANOVA followed by Tukey’s test was used. **p < 0.01 and ns indicated non-significant.
Figure 3
Figure 3
Sample type comparisons. (A) The correlations of areas under the curve (AUCs) of metabolites between wet blood and DBS. All 430 detected metabolites were used and the AUCs were log 2 transformed. The Spearman rank correlation was performed. The other correlation analyses in this figure were similarily performed. (B) The correlations of metabolite AUCs between Li-hep DBS and EDTA DBS. (C) The differentially abundant metabolites between Li-hep DBS and EDTA DBS visualized on the heatmap. The top 25 significant metabolites ranked by the student’s t-test were listed. p < 0.01. (D) The correlations of metabolite AUCs between Li-hep DBS and fingerstick DBS. (E) A Principal component analysis (PCA) of the five different sample collection methods showed that samples collected by fingerstick lancet and heparinized venous blood were superimposable.
Figure 4
Figure 4
Stability analysis. (AC) The fractional change over a year from the baseline for the geomean of all detected metabolites. (A) DBS stored at room temperature (RT) with desiccant and an O2 scavenger (RT with desiccant and an O2 scavenger). (B) DBS stored in −80 °C with desiccant and an O2 scavenger. (C) DBS stored in −80 °C with desiccant. The shaded area represents the standard deviations (SD). (D) The number of metabolites altered in a year of storage in different conditions. (E) The chemical classes for the metabolites with ≥ 30% decline in one year. The number of metabolites changed was listed in the graph and the total number of targeted metabolites in each chemical class was shown in the legend. (F) The percentage of reduction (%) from the baseline for the metabolites in the major chemical classes. The value in the bar graph was the total number of metabolites in each chemical class. A one-way ANOVA followed by Tukey’s test was conducted. Data indexed by different letters (“a” and “b”) were significantly different from each other (p < 0.05) in each storage condition. (G) The number of stable metabolites over one year of storage in each storage condition. The names of the stable metabolites are listed in Table S7.
Figure 5
Figure 5
Metabolomic fingerprints and biomarkers in DBS of MELAS patients. (A) Partial least squares discriminant analysis (PLS-DA) revealed the complete separation of MELAS patients from the controls (N = 12/group). (B) variable importance in projection (VIP) plot of the top 20 metabolites with the highest separation power between the controls and MELAS patients in PLS-DA. A VIP score > 1.5 was considered as statistically significant. (C) A pathway analysis of the significantly altered metabolites in the DBS of MELAS patients compared to the controls. The fractional impact of a pathway is defined as the sum of the absolute values of z-scores for the significant metabolites (PLS-DA VIP score > 1.5) divided by the sum of the absolute values of z-scores for all the detected metabolites in that pathway. (D) The top 20 metabolites correlated with heteroplasmy. A Spearman correlation analysis was performed. (E) A receiver operator characteristic (ROC) analysis to evaluate the diagnostic performance of three selected metabolites in DBS for MELAS. (F) The diagnostic performance of the same three metabolites in Li-heparin liquid whole blood for MELAS. Data were log 2 transformed before analysis. (GI) Univariate statistical analysis of three selected biomarkers in the DBS of MELAS and controls. A Student’s t-test was performed after the log 2 transformation of the data.

References

    1. Naviaux R.K., Naviaux J.C., Li K., Bright A.T., Alaynick W.A., Wang L., Baxter A., Nathan N., Anderson W., Gordon E. Metabolic features of chronic fatigue syndrome. Proc. Natl. Acad. Sci. USA. 2016;113:E5472–E5480. doi: 10.1073/pnas.1607571113. - DOI - PMC - PubMed
    1. Naviaux R.K., Naviaux J.C., Li K., Wang L., Monk J.M., Bright A.T., Koslik H.J., Ritchie J.B., Golomb B.A. Metabolic features of Gulf War illness. PLoS ONE. 2019;14:e0219531. doi: 10.1371/journal.pone.0219531. - DOI - PMC - PubMed
    1. Johnson C.H., Ivanisevic J., Siuzdak G. Metabolomics: Beyond biomarkers and towards mechanisms. Nat. Rev. Mol. Cell Biol. 2016;17:451–459. doi: 10.1038/nrm.2016.25. - DOI - PMC - PubMed
    1. Kirwan J.A., Brennan L., Broadhurst D., Fiehn O., Cascante M., Dunn W.B., Schmidt M.A., Velagapudi V. Preanalytical Processing and Biobanking Procedures of Biological Samples for Metabolomics Research: A White Paper, Community Perspective (for “Precision Medicine and Pharmacometabolomics Task Group”—The Metabolomics Society Initiative) Clin. Chem. 2018;64:1158–1182. doi: 10.1373/clinchem.2018.287045. - DOI - PubMed
    1. Guthrie R., Susi A. A Simple Phenylalanine Method for Detecting Phenylketonuria in Large Populations of Newborn Infants. Pediatrics. 1963;32:338–343. - PubMed

LinkOut - more resources