

On the Detection of Spectral Emissions of Iron Oxides in Combustion Experiments of Pyrite Concentrates
- PMID: 32120881
- PMCID: PMC7085799
- DOI: 10.3390/s20051284
On the Detection of Spectral Emissions of Iron Oxides in Combustion Experiments of Pyrite Concentrates
Erratum in
-
Erratum: Toro, C. et al. On the Detection of Spectral Emissions of Iron Oxides in Combustion Experiments of Pyrite Concentrates. Sensors 2020, 20, 1284.Sensors (Basel). 2020 Oct 28;20(21):6141. doi: 10.3390/s20216141. Sensors (Basel). 2020. PMID: 33126777 Free PMC article.
Abstract
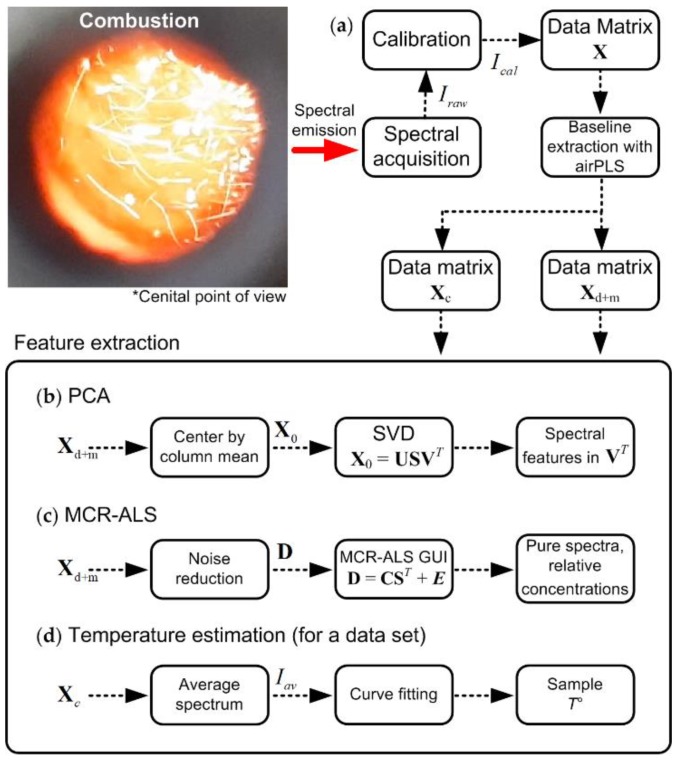
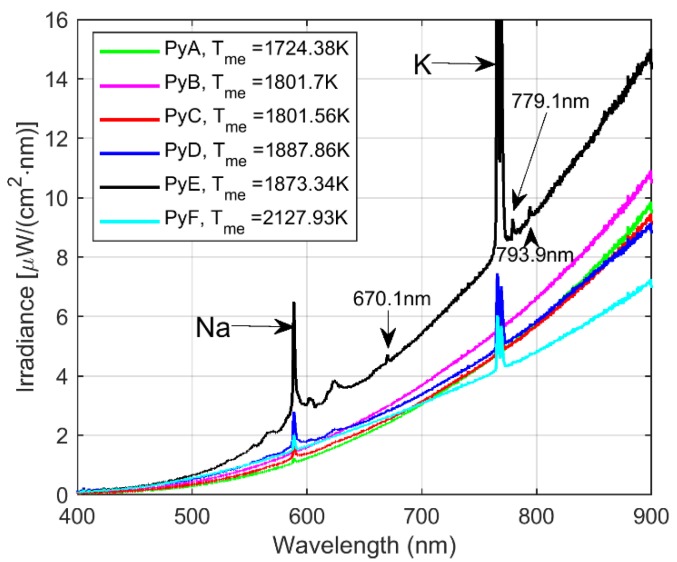
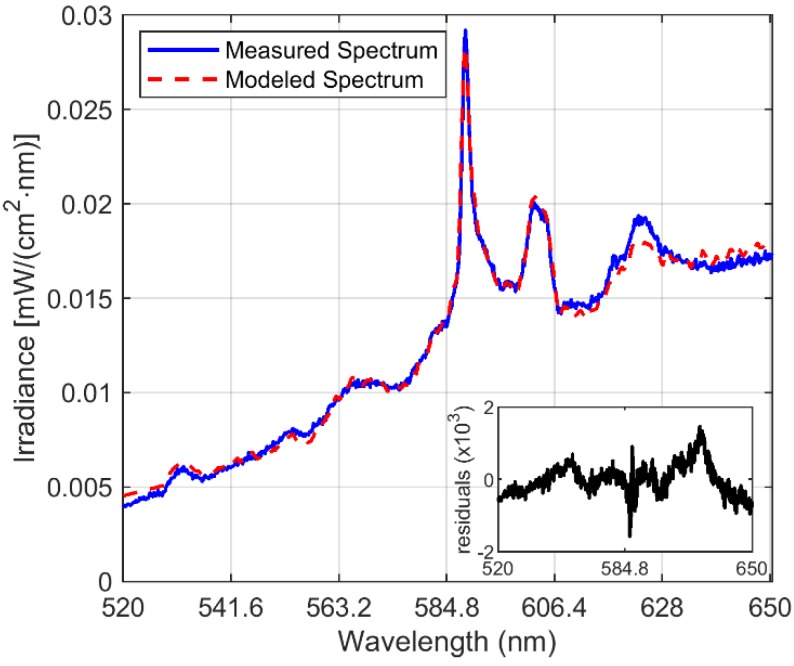
In this paper, we report on the spectral detection of wustite, Fe(II) oxide (FeO), and magnetite, Fe(II, III) oxide (Fe3O4), molecular emissions during the combustion of pyrite (FeS2), in a laboratory-scale furnace operating at high temperatures. These species are typically generated by reactions occurring during the combustion (oxidation) of this iron sulfide mineral. Two detection schemes are addressed: the first consisting of measurements with a built-in developed spectrometer with a high sensitivity and a high spectral resolution. The second one consisting of spectra measured with a low spectral resolution and a low sensitivity commercial spectrometer, but enhanced and analyzed with post signal processing and multivariate data analysis such as principal component analysis (PCA) and a multivariate curve resolution - the alternating least squares method (MCR-ALS). A non-linear model is also proposed to reconstruct spectral signals measured during pyrite combustion. Different combustion conditions were studied to evaluate the capacity of the detection schemes to follow the spectral emissions of iron oxides. The results show a direct correlation between FeO and Fe3O4 spectral features intensity, and non-linear relations with key combustion variables such as flame temperature, and the combusted sulfide mineral particle size.
Keywords: combustion; multivariate data analysis; optical sensors; principal component analysis; signal detection; signal processing; signal reconstruction; spectral measurements.
Conflict of interest statement
The authors declare no conflict of interest.
Figures


References
-
- Yañez J., Torres S., Sbarbaro D., Parra R., Saavedra C. Analytical instrumentation for copper pyrometallurgy: Challenges and opportunities; Proceedings of the 5th IFAC Workshop on Mining, Mineral and Metal Processing; Shanghai, China. 23–25 August 2018; pp. 251–256.
-
- Schlesinger M., King M., Sole K., Davenport W.G. Extractive Metallurgy of Copper. 5th ed. Elsevier; Amsterdam, The Netherlands: 2011.
-
- Docquier N., Candel S. Combustion control and sensors: A review. J. Prog. Energy Combust. Sci. 2002;28:107–150. doi: 10.1016/S0360-1285(01)00009-0. - DOI
Grants and funding
LinkOut - more resources
Full Text Sources
Miscellaneous
