. 2020 Feb 27;9(3):638.
doi: 10.3390/jcm9030638.

The Dynamics of Respiratory Microbiota during Mechanical Ventilation in Patients with Pneumonia

Affiliations

The Dynamics of Respiratory Microbiota during Mechanical Ventilation in Patients with Pneumonia

Seongji Woo et al. J Clin Med. .

Abstract

Bacterial pneumonia is a major cause of mechanical ventilation in intensive care units. We hypothesized that the presence of particular microbiota in endotracheal tube aspirates during the course of intubation was associated with clinical outcomes such as extubation failure or 28-day mortality. Sixty mechanically ventilated ICU (intensive care unit) patients (41 patients with pneumonia and 19 patients without pneumonia) were included, and tracheal aspirates were obtained on days 1, 3, and 7. Gene sequencing of 16S rRNA was used to measure the composition of the respiratory microbiome. A total of 216 endotracheal aspirates were obtained from 60 patients. A total of 22 patients were successfully extubatedwithin3 weeks, and 12 patients died within 28days. Microbiota profiles differed significantly between the pneumonia group and the non-pneumonia group (Adonis, p < 0.01). While α diversity (Shannon index) significantly decreased between day 1 and day 7 in the successful extubation group, it did not decrease in the failed extubation group among intubated patients with pneumonia. There was a significant difference in the change of βdiversity between the successful extubation group and the failed extubation group for Bray-Curtis distances (p < 0.001). At the genus level, Rothia, Streptococcus, and Prevotella correlated with the change of β diversity. A low relative abundance of Streptococci at the time of intubation was strongly associated with 28-day mortality. The dynamics of respiratory microbiome were associated with clinical outcomes such as extubation failure and mortality. Further large prospective studies are needed to test the predictive value of endotracheal aspirates in intubated patients.

Keywords: mechanical ventilation; microbiome; pneumonia.


Conflict of interest statement

The authors declare that they have no conflicts of interests.

Figures
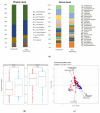
Figure 1
Figure 1
The respiratory microbiome differed between intubated patients with pneumonia and those without pneumonia. (a) Lower respiratory tract microbiome composition at phylum and genus levels. (b) Shannon diversity index and Simpson index. Red: pneumonia group, blue: non-pneumonia group. (c) Bray–Curtis distance of the respiratory microbiota, shown as a principal coordinate analysis (PCoA) two-dimensional map. Each dot represents one sample. (d) Histogram of unique biomarker bacteria detected based on the linear discriminant analysis (LDA) effect size (>2.5-fold).
Figure 1
Figure 1
The respiratory microbiome differed between intubated patients with pneumonia and those without pneumonia. (a) Lower respiratory tract microbiome composition at phylum and genus levels. (b) Shannon diversity index and Simpson index. Red: pneumonia group, blue: non-pneumonia group. (c) Bray–Curtis distance of the respiratory microbiota, shown as a principal coordinate analysis (PCoA) two-dimensional map. Each dot represents one sample. (d) Histogram of unique biomarker bacteria detected based on the linear discriminant analysis (LDA) effect size (>2.5-fold).
Figure 2
Figure 2
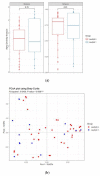
The respiratory microbiome of intubated patients with pneumonia differed between the failed extubation (Group1) and successful extubation groups (Group2). (a) Shannon diversity index and Simpson index. (b) Bray–Curtis distance of the respiratory microbiota, shown as a PCoA two-dimensional map. Each dot represents one sample. (c) Histogram of unique biomarker bacteria detected based on the LDA effect size (>2.5-fold).
Figure 2
Figure 2
The respiratory microbiome of intubated patients with pneumonia differed between the failed extubation (Group1) and successful extubation groups (Group2). (a) Shannon diversity index and Simpson index. (b) Bray–Curtis distance of the respiratory microbiota, shown as a PCoA two-dimensional map. Each dot represents one sample. (c) Histogram of unique biomarker bacteria detected based on the LDA effect size (>2.5-fold).
Figure 3
Figure 3
Longitudinal changes in the respiratory microbiota in intubated patients with pneumonia. (a) Changes in α-diversity between days 1 and 7 after initiation of mechanical ventilation. The Shannon diversity index and Simpson index are measures of α-diversity. Left, successful extubation group (Group1); right, failed extubation group (Group2). (b) PCoA plots of the Bray–Curtis distance of the respiratory microbiota. Each color represents the day. Left, successful extubation group (Group1); right, failed extubation group (Group 2). (c) Changes in Bray–Curtis distance are shown as red dashed lines for the successful extubation group, and blue dashed lines for the failed extubation group. Black and gray arrows indicate mean changes in the successful extubation and failed extubation groups between two time points. Logistic regression analysis showed that the changes in PCo2 significantly differed between the two groups (p = 0.001).
Figure 3
Figure 3
Longitudinal changes in the respiratory microbiota in intubated patients with pneumonia. (a) Changes in α-diversity between days 1 and 7 after initiation of mechanical ventilation. The Shannon diversity index and Simpson index are measures of α-diversity. Left, successful extubation group (Group1); right, failed extubation group (Group2). (b) PCoA plots of the Bray–Curtis distance of the respiratory microbiota. Each color represents the day. Left, successful extubation group (Group1); right, failed extubation group (Group 2). (c) Changes in Bray–Curtis distance are shown as red dashed lines for the successful extubation group, and blue dashed lines for the failed extubation group. Black and gray arrows indicate mean changes in the successful extubation and failed extubation groups between two time points. Logistic regression analysis showed that the changes in PCo2 significantly differed between the two groups (p = 0.001).
Figure 4
Figure 4
Microbial network of intubated patients with pneumonia, consisting of 53 nodes and 60 edges. Edges show associations with FDR (false-discovery rate) q-values < 0.05 with bidirectionality. Each edge indicates a significant correlation between OTUs; blue, n = 54, positive; yellow, n = 6, negative.
Figure 5
Figure 5
Association between respiratory microbiome and 28-day mortality in intubated patients with pneumonia. (a) Shannon diversity index and Simpson index. (b) Bray–Curtis distance between samples, shown as a PCoA two-dimensional map. Each dot represents one sample. (c) Histogram of unique biomarker bacteria detected based on the LDA effect size (>2.5-fold). (d) ROC curve for the association between 28-day survival and the relative abundance of Streptococcus in ETA at day 1.LDA, linear discriminating analysis; ROC, receiver operating characteristics; ETA, endotracheal aspirate.
Figure 5
Figure 5
Association between respiratory microbiome and 28-day mortality in intubated patients with pneumonia. (a) Shannon diversity index and Simpson index. (b) Bray–Curtis distance between samples, shown as a PCoA two-dimensional map. Each dot represents one sample. (c) Histogram of unique biomarker bacteria detected based on the LDA effect size (>2.5-fold). (d) ROC curve for the association between 28-day survival and the relative abundance of Streptococcus in ETA at day 1.LDA, linear discriminating analysis; ROC, receiver operating characteristics; ETA, endotracheal aspirate.

References

    1. Xu J., Murphy S.L., Kochanek K.D., Bastian B., Arias E. Deaths: Final data for 2016. Natl. Vital Stat. Rep. 2018;67:1–76. - PubMed
    1. Jain S., Self W.H., Wunderink R.G., Fakhran S., Balk R., Bramley A.M., Chappell J.D. Community-acquired pneumonia requiring hospitalization among U.S. adults. N. Engl. J. Med. 2015;373:415–427. doi: 10.1056/NEJMoa1500245. - DOI - PMC - PubMed
    1. Valley T.S., Sjoding M.W., Ryan A.M., Iwashyna T.J., Cooke C.R. Association of intensive care unit admission with mortality among older patients with pneumonia. JAMA. 2015;314:1272–1279. doi: 10.1001/jama.2015.11068. - DOI - PMC - PubMed
    1. Kalil A.C., Metersky M.L., Klompas M., Muscedere J., Sweeney D.A., Palmer L.B., El Solh A.A. Executive Summary: Management of Adults with Hospital-acquired and Ventilator-associated Pneumonia: 2016 Clinical Practice Guidelines by the Infectious Diseases Society of America and the American Thoracic Society. Clin. Infect. Dis. 2016;63:575–582. doi: 10.1093/cid/ciw504. - DOI - PMC - PubMed
    1. Esperatti M., Ferrer M., Theessen A., Liapikou A., Valencia M., Saucedo L.M., Torres A. Nosocomial pneumonia in the intensive care unit acquired by mechanically ventilated versus nonventilated patients. Am. J. Respir. Crit. Care Med. 2010;182:1533–1539. doi: 10.1164/rccm.201001-0094OC. - DOI - PubMed

LinkOut - more resources