. 2020 Feb 29;29(1):70-79.
doi: 10.5607/en.2020.29.1.70.

Expression of Cellular Receptors in the Ischemic Hemisphere of Mice with Increased Glucose Uptake

Affiliations

Expression of Cellular Receptors in the Ischemic Hemisphere of Mice with Increased Glucose Uptake

Jin Soo Lee et al. Exp Neurobiol. .

Abstract

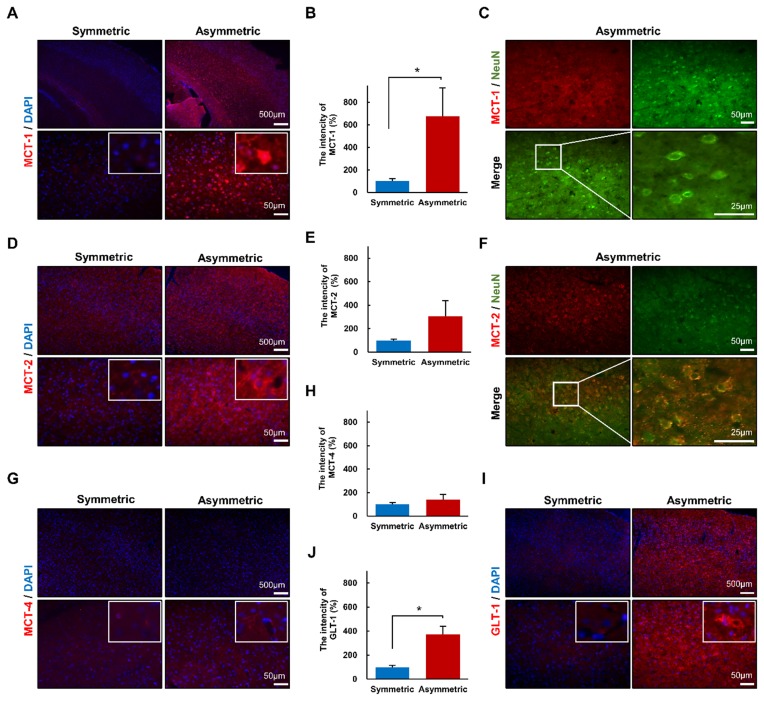
Many previous studies have shown reduced glucose uptake in the ischemic brain. In contrast, in a permanent unilateral common carotid artery occlusion (UCCAO) mouse model, our pilot experiments using 18F-fluorodeoxyglucose positron emission tomography (FDG PET) revealed that a subset of mice exhibited conspicuously high uptake of glucose in the ipsilateral hemisphere at 1 week post-occlusion (asymmetric group), whereas other mice showed symmetric uptake in both hemispheres (symmetric group). Thus, we aimed to understand the discrepancy between the two groups. Cerebral blood flow and histological/metabolic changes were analyzed using laser Doppler flowmetry and immunohistochemistry/Western blotting, respectively. Contrary to the increased glucose uptake observed in the ischemic cerebral hemisphere on FDG PET (p<0.001), cerebral blood flow tended to be lower in the asymmetric group than in the symmetric group (right to left ratio [%], 36.4±21.8 vs. 58.0±24.8, p=0.059). Neuronal death was observed only in the ischemic hemisphere of the asymmetric group. In contrast, astrocytes were more activated in the asymmetric group than in the symmetric group (p<0.05). Glucose transporter-1, and monocarboxylate transporter-1 were also upregulated in the asymmetric group, compared with the symmetric group (p<0.05, respectively). These results suggest that the increased FDG uptake was associated with relatively severe ischemia, and glucose transporter-1 upregulation and astrocyte activation. Glucose metabolism may thus be a compensatory mechanism in the moderately severe ischemic brain.

Keywords: 4-fluoro-4-deoxyglucose; Astrocytes; Brain ischemia; Glucose transporter type 1; Positron-emission tomography.


Figures

Fig. 1
Fig. 1
An incidental observation using 18F-fluorodeoxyglucose positron emission tomography in mice, following unilateral common carotid artery occlusion (UCCAO). In our pilot evaluations, glucose uptake patterns were classified into two types after the operation. (A) An example of a mouse brain with symmetrical uptake despite right UCCAO. In most mice with the UCCAO operation, glucose uptake was symmetrical. (B) An example of a mouse brain with asymmetrical glucose uptake in the ischemic hemisphere (right side on the figure). In a subset of mice, glucose uptake was found to asymmetrically increase in the right hemisphere. (C) To determine the most appropriate time for viewing asymmetric glucose uptake, UCCAO-operated (n=3 per day) and sham-operated mice (n=1 per day) were examined at days 1, 4, 7, 10, 14, 21, and 28 after the operation. One of three UCCAO mice showed an increase in glucose uptake at 7 and 10 days, respectively. One of three UCCAO mice showed a decrease in glucose uptake at 28 days. Otherwise, symmetric glucose uptake patterns were shown. The seventh day was selected for further glucose uptake evaluations.
Fig. 2
Fig. 2
Absolute value of glucose uptake in the region of interest of each hemisphere for the 18F-fluorodeoxyglucose positron emission tomography scans. Comparisons were made among the unilateral common carotid artery occlusion-operated mice with and without asymmetric uptake, and sham-operated mice. (A) The quantity of glucose uptake in the ipsilateral hemisphere was greater in the asymmetric group than in the other groups. (B) The quantity of glucose uptake in the contralateral hemisphere did not decrease in the asymmetric group, relative to other groups. (C) Finally, the uptake ratio of the right to left hemisphere was higher in the asymmetric group than in the other groups. * p<0.001.
Fig. 3
Fig. 3
Comparison of cerebral blood flow in the right hemisphere between the symmetric and asymmetric groups, as measured by laser Doppler flowmetry. Among 33 unilateral common carotid artery occlusion-operated mice whose laser Doppler flowmetry and 18Ffluorodeoxyglucose positron emission tomography scan were both taken at 7 days after the operation, six mice exhibited asymmetric increases in glucose uptake within their right hemispheres (i.e., asymmetric group) while twenty seven mice showed a symmetric pattern (symmetric group). Cerebral perfusion tended to be lower in the ipsilesional hemisphere of the asymmetric group, compared to the symmetric group (p=0.059).
Fig. 4
Fig. 4
Comparison of histological changes between symmetric and asymmetric groups. Neuronal damage was not seen in any mouse within the symmetric group. However, the asymmetric group showed evidence of neuronal necrosis and apoptosis using cresyl violet and caspase-3 staining, respectively. (A) Cresyl violet staining in the cortex of the mouse brain. (B) The number of neuronal cells that survived tended to decrease in the ischemic hemisphere of the asymmetric group compared to symmetric group; however, this was not statistically significant (p=0.186). (C) Immunohistochemistry of active caspase-3 in the cortex of the ischemic hemisphere. (D) Apoptotic cells were frequently observed in the ischemic hemisphere of the asymmetric group compared to the symmetric group; however, this was not statistically significant (p=0.177). Data are expressed as the mean±standard error of the mean (n=6/group).
Fig. 5
Fig. 5
Expression of GLUT1, GLUT3, and GFAP in the ipsilesional cortex of the mouse brain with right UCCAO. (A) An increase in the immuno-histochemical expression of GLUT1 (red) was observed in the vessels of the asymmetric group, compared with the symmetric group. (B) Double immunofluorescence staining of GLUT1 and GFAP. GLUT1 along the vessels showed co-localization with an astrocytic foot process in the asymmetric group. (C) Intensity measurement to quantify the GLUT1 level showed a significant increase in the asymmetric group (n=6/group, p<0.05). (D) Western blot analysis of GLUT1 (55 kDa) in the ischemic hemisphere of the mouse brain. Quantitation of GLUT1 expression was performed, relative to actin expression. The GLUT1 level was significantly increased in the asymmetric group compared to the symmetric group (n=3/group, p<0.05). (E) Immunohistochemical expression of GFAP (green), indicating astrocyte activation, was observed to increase in the asymmetric group. (F) GFAP-positive cells were more frequently observed in the right hemisphere of the asymmetric group than in the symmetric group, however, this difference was not statistically significant (n=6/group). (G) Western blot analysis of GFAP (55k Da) shows significantly increased expression in the right cortex of the asymmetric group compared to the symmetric group (n=3/group, p<0.05). (H) GLUT3 (red) expression was faintly observed in both groups. (I) Intensity of GLUT3 did not differ between the two groups (n=6/group). (J) Western blot analysis of GLUT3 (54 kDa) showed no difference between the two groups (n=3/ group). Data are expressed as the mean±standard error of the mean. GLUT, anti-glucose transporter; GFAP, glial fibrillary acidic protein. *p<0.05 (t -test).
Fig. 6
Fig. 6
Immunohistochemistry analysis of MCT-1, MCT-2, MCT-4, and GLT-1 in the cortex of the ipsilesional hemisphere of the UCCAO mouse brains (A) MCT-1 expression was observed to increase in the asymmetric group. (B) Intensity of MCT-1 significantly differed between groups (n=6 per each group, p<0.05). (C) MCT-1 appeared to colocalize with neurons in the ischemic hemisphere of the asymmetric group. (D) MCT-2 expression tended to increase in the asymmetric group. (E) The difference did not reach statistical significance (n=6 per each group). (F) MCT-2 appeared to colocalize with neurons in the ischemic hemisphere of the asymmetric group. (G) MCT-4 expression was found along the vessels. (H) The expression did not differ between groups (n=6). (I) GLT-1 (red) expression was observed to increase in the asymmetric group. (J) The intensity of GLT-1 significantly differed between groups (n=4 per each group, p<0.05). No specific findings were observed in the contralateral hemisphere in the asymmetric brains. Data are expressed as the mean±standard error of the mean. GLT, glutamate transporter; MCT, monocarboxylate transporter; UCCAO, unilateral common carotid artery occlusion. *p<0.05; t -test.

References

    1. Astrup J, Siesjö BK, Symon L. Thresholds in cerebral ischemia - the ischemic penumbra. Stroke. 1981;12:723–725. doi: 10.1161/01.STR.12.6.723. - DOI - PubMed
    1. Lenzi GL, Frackowiak RS, Jones T. Cerebral oxygen metabolism and blood flow in human cerebral ischemic infarction. J Cereb Blood Flow Metab. 1982;2:321–335. doi: 10.1038/jcbfm.1982.33. - DOI - PubMed
    1. Balsara RD, Chapman SE, Sander IM, Donahue DL, Liepert L, Castellino FJ, Leevy WM. Non-invasive imaging and analysis of cerebral ischemia in living rats using positron emission tomography with 18F-FDG. J Vis Exp. 2014;(94):e51495. - PMC - PubMed
    1. Sobrado M, Delgado M, Fernández-Valle E, García-García L, Torres M, Sánchez-Prieto J, Vivancos J, Manzanares R, Moro MA, Pozo MA, Lizasoain I. Longitudinal studies of ischemic penumbra by using 18F-FDG PET and MRI techniques in permanent and transient focal cerebral ischemia in rats. Neuroimage. 2011;57:45–54. doi: 10.1016/j.neuroimage.2011.04.045. - DOI - PubMed
    1. Powers WJ. Cerebral blood flow and metabolism: regulation and pathophysiology in cerebrovascular disease. In: Grotta JC, Albers G, Broderick JP, Kasner SE, Lo EH, Mendelow AD, Sacco RL, Wong KSL, editors. Stroke: pathophysiology, diagnosis, and management. 6th ed. Elsevier; Philaldephia: 2016. pp. 28–46. - DOI