Comparative functional genomics analysis of cytochrome P450 gene superfamily in wheat and maize
- PMID: 32122306
- PMCID: PMC7052972
- DOI: 10.1186/s12870-020-2288-7
Comparative functional genomics analysis of cytochrome P450 gene superfamily in wheat and maize
Abstract
Background: The cytochrome P450s (CYP450s) as the largest enzyme family of plant metabolism participate in various physiological processes, whereas no study has demonstrated interest in comprehensive comparison of the genes in wheat and maize. Genome-wide survey, characterization and comparison of wheat and maize CYP450 gene superfamily are useful for genetic manipulation of the Gramineae crops.
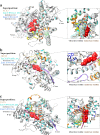
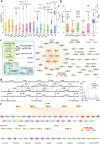
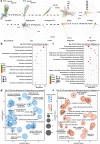
Results: In total, 1285 and 263 full-length CYP450s were identified in wheat and maize, respectively. According to standard nomenclature, wheat CYP450s (TaCYP450s) were categorized into 45 families, while maize CYP450s (ZmCYP450s) into 43 families. A comprehensive analysis of wheat and maize CYP450s, involved in functional domains, conserved motifs, phylogeny, gene structures, chromosome locations and duplicated events was performed. The result showed that each family/subfamily in both species exhibited characteristic features, suggesting their phylogenetic relationship and the potential divergence in their functions. Functional divergence analysis at the amino acid level of representative clans CYP51, CYP74 and CYP97 in wheat, maize and rice identified some critical amino acid sites that are responsible for functional divergence of a gene family. Expression profiles of Ta-, ZmCYP450s were investigated using RNA-seq data, which contribute to infer the potential functions of the genes during development and stress responses. We found in both species CYP450s had preferential expression in specific tissues, and many tissue-specific genes were identified. Under water-deficit condition, 82 and 39 significantly differentially expressed CYP450s were respectively detected in wheat and maize. These genes may have some roles in protecting plants against drought damage. Thereinto, fourteen CYP450s were selected to validate their expression level through qRT-PCR. To further elucidating molecular mechanisms of CYP450 action, gene co-expression network was constructed. In total, 477 TaCYP450s were distributed in 22 co-expression modules, and some co-expressed genes that likely take part in the same biochemical pathway were identified. For instance, the expression of TaCYP74A98_4D was highly correlated with TaLOX9, TaLOX36, TaLOX39, TaLOX44 and TaOPR8, and all of them may be involved in jasmonate (JA) biosynthesis. TaCYP73A201_3A showed coexpression with TaPAL1.25, TaCCoAOMT1.2, TaCOMT.1, TaCCR1.6 and TaLAC5, which probably act in the wheat stem and/or root lignin synthesis pathway.
Conclusion: Our study first established systematic information about evolutionary relationship, expression pattern and function characterization of CYP450s in wheat and maize.
Keywords: Cytochrome P450; Drought stress; Expression regulation; Gramineae crops; Growth and development.
Conflict of interest statement
The authors declare that they have no competing interests.
Figures


Similar articles
-
Comparative functional genomics analysis of bHLH gene family in rice, maize and wheat.BMC Plant Biol. 2018 Nov 29;18(1):309. doi: 10.1186/s12870-018-1529-5. BMC Plant Biol. 2018. PMID: 30497403 Free PMC article.
-
Genome-wide identification of Gramineae histone modification genes and their potential roles in regulating wheat and maize growth and stress responses.BMC Plant Biol. 2021 Nov 20;21(1):543. doi: 10.1186/s12870-021-03332-8. BMC Plant Biol. 2021. PMID: 34800975 Free PMC article.
-
Genome-wide characterization of JASMONATE-ZIM DOMAIN transcription repressors in wheat (Triticum aestivum L.).BMC Genomics. 2017 Feb 13;18(1):152. doi: 10.1186/s12864-017-3582-0. BMC Genomics. 2017. PMID: 28193162 Free PMC article.
-
Functional genomics of P450s.Annu Rev Plant Biol. 2003;54:629-67. doi: 10.1146/annurev.arplant.54.031902.134840. Annu Rev Plant Biol. 2003. PMID: 14503006 Review.
-
Benzoxazinoid biosynthesis, a model for evolution of secondary metabolic pathways in plants.Phytochemistry. 2009 Oct-Nov;70(15-16):1645-51. doi: 10.1016/j.phytochem.2009.05.012. Epub 2009 Jul 3. Phytochemistry. 2009. PMID: 19577780 Review.
Cited by
-
Genome-Wide Analysis of the Cytochrome P450 Gene Family Involved in Salt Tolerance in Gossypium hirsutum.Front Plant Sci. 2021 Dec 2;12:685054. doi: 10.3389/fpls.2021.685054. eCollection 2021. Front Plant Sci. 2021. PMID: 34925390 Free PMC article.
-
Phylogenomic Analysis of Cytochrome P450 Gene Superfamily and Their Association with Flavonoids Biosynthesis in Peanut (Arachis hypogaea L.).Genes (Basel). 2023 Oct 15;14(10):1944. doi: 10.3390/genes14101944. Genes (Basel). 2023. PMID: 37895293 Free PMC article.
-
Genome-wide identification of the CYP82 gene family in cucumber and functional characterization of CsCYP82D102 in regulating resistance to powdery mildew.PeerJ. 2024 Mar 28;12:e17162. doi: 10.7717/peerj.17162. eCollection 2024. PeerJ. 2024. PMID: 38560464 Free PMC article.
-
Transcriptomic analysis of saffron at different flowering stages using RNA sequencing uncovers cytochrome P450 genes involved in crocin biosynthesis.Mol Biol Rep. 2021 Apr;48(4):3451-3461. doi: 10.1007/s11033-021-06374-1. Epub 2021 May 2. Mol Biol Rep. 2021. PMID: 33934248
-
Novel insights into maize (Zea mays) development and organogenesis for agricultural optimization.Planta. 2023 Apr 9;257(5):94. doi: 10.1007/s00425-023-04126-y. Planta. 2023. PMID: 37031436 Review.
References
-
- Kandel S, Sauveplane V, Olry A, et al. Cytochrome P450-dependent fatty acid hydroxylases in plants. Phytochem Rev. 2006;5(2–3):359–372. doi: 10.1007/s11101-006-9041-1. - DOI
-
- Ueyama Y, Suzuki KI, Fukuchi-Mizutani M, Fukui Y, Miyazaki K, Ohkawa H, et al. Molecular and biochemical characterization of torenia flavonoid 3′-hydroxylase and flavone synthase II and modification of flower color by modulating the expression of these genes. Plant Sci. 2002;163:253–263. doi: 10.1016/S0168-9452(02)00098-5. - DOI
MeSH terms
Substances
LinkOut - more resources
Full Text Sources

