Review
. 2021 Mar 1;11(3):a039503.
doi: 10.1101/cshperspect.a039503.

Integrating Family-Based and Mendelian Randomization Designs

Affiliations
Review

Integrating Family-Based and Mendelian Randomization Designs

Liang-Dar Hwang et al. Cold Spring Harb Perspect Med. .

Abstract

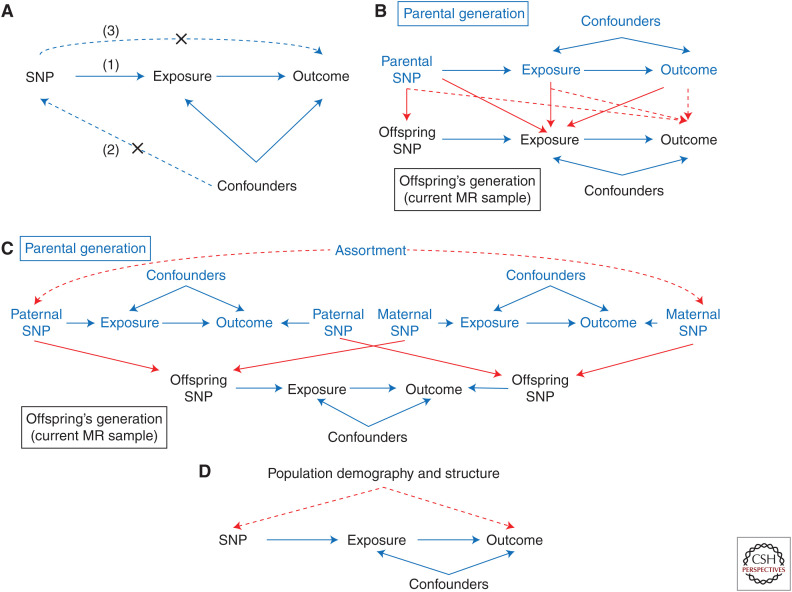
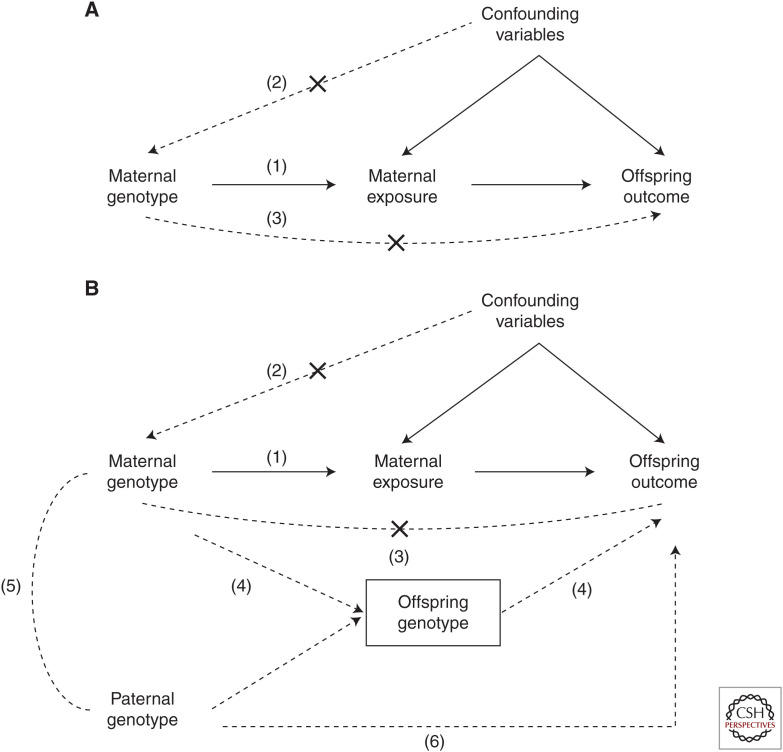
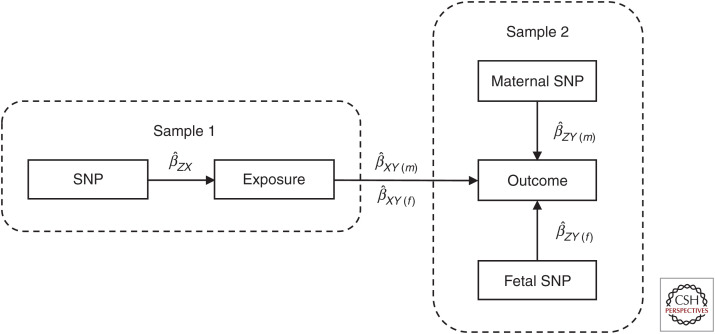
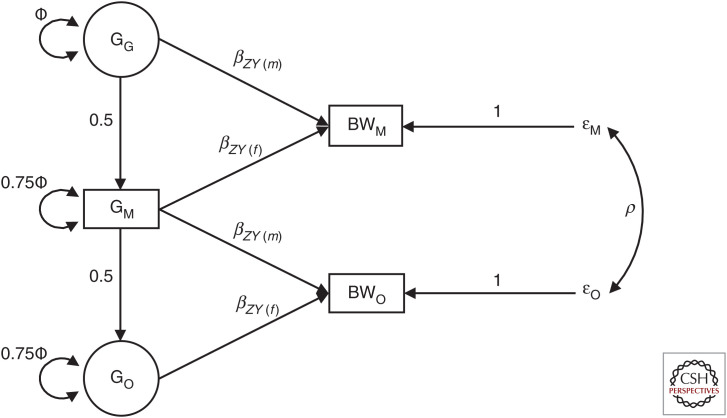
Most Mendelian randomization (MR) studies published in the literature to date have involved analyses of unrelated, putatively independent sets of individuals. However, estimates obtained from these sorts of studies are subject to a range of biases including dynastic effects, assortative mating, residual population stratification, and horizontal pleiotropy. The inclusion of related individuals in MR studies can help control for and, in some cases, estimate the effect of these biases on causal parameters. In this review, we discuss these biases, how they can affect MR studies, and describe three sorts of family-based study designs that can be used to control for them. We conclude that including family information from related individuals is not only possible given the world's existing twin, birth, and large-scale population-based cohorts, but likely to reap rich rewards in understanding the etiology of complex traits and diseases in the near future.


Figures

Figure 1.
Figure 1.
Genetic variants are valid instrumental variables for Mendelian randomization (MR) if they satisfy three core assumptions: (1) they associate with the exposure of interest, (2) there are no confounders of the genetic marker–outcome association, and (3) the genetic variants only affect the outcome via the exposure of interest. These core assumptions are depicted in A. (AD) The solid blue arrows represent relationships within an individual (e.g., the effects of offspring single-nucleotide polymorphisms [SNPs] on offspring exposure). The red lines represent the effects of relationships between individuals (e.g., the direct effects of parents’ phenotypes on their children). Dynastic effects, shown in B, refer to any effect of parental genotype on the offspring outcome that is not mediated via the offspring exposure. These effects are indicated by the dashed red lines in B. Dynastic effects violate the second core assumption for a valid genetic instrument by opening a path from offspring SNPs to offspring outcome that is not due to the offspring exposure. Cross-trait assortative mating, as shown in C, induces associations between SNPs related to the exposure and the outcome in the parental generation (indicated by dashed red lines). If the parents assort on the exposure and the outcome (e.g., more educated females tending to mate with taller men, as indicated by the dashed red arrow in C), then this will induce correlation between exposure-related SNPs and the outcome in the offspring generation that is not mediated by the offspring exposure (i.e., outcome ← offspring SNP ← maternal SNP—assortment—paternal SNP → offspring SNP → exposure). Therefore, assortative mating can bias MR estimates of the causal effect. Finally, population structure and demography can also open a path from SNP to outcome, which is not mediated via the exposure of interest, and introduce bias, as shown in D. (Figure based on data in Brumpton et al. 2019.)
Figure 2.
Figure 2.
Directed acyclic graphs showing the three core assumptions underlying Mendelian randomization (MR). (A,B) Assumption (1) requires that maternal genetic variants must be robustly associated with the maternal exposure of interest. Assumption (2) requires that the genetic variants are uncorrelated with confounders of the maternal exposure–offspring outcome relationship. Assumption (3) requires that the genetic variants are only potentially associated with the offspring outcome through the maternal exposure of interest. Offspring genetic variants violate assumption (3), as they permit a path to the offspring outcome that is not mediated by the maternal exposure (4). However, conditioning on offspring variants (as indicated by a box around the offspring single-nucleotide polymorphism [SNP]), blocks path (4). Conditioning on offspring genotype induces a correlation between maternal and paternal genotypes (5). This may produce biased estimates of the causal effect (collider bias) if markers at the same loci (or loci in linkage disequilibrium with them) also exert paternal genetic effects on the offspring phenotype (6). This possibility can be prevented by conditioning on paternal genotype as well as offspring genotype in the analysis. (Figure based on data in Evans et al. 2019.)
Figure 3.
Figure 3.
Two-sample Mendelian randomization study testing the causal effect of a maternal exposure on an offspring outcome. Estimates of the single-nucleotide polymorphism (SNP)-exposure association (β^ZX) are calculated in the first sample of unrelated individuals. The association between these same SNPs and the offspring outcome is then estimated in the second sample of individuals, except in this case, the genetic association is partitioned into maternal (β^ZY(m)) and offspring (β^ZY(f)) genetic effects on the outcome (see Fig. 4 for how these can be estimated using structural equation modeling). These estimates are then combined to yield estimates of the causal effect of the maternal exposure on the offspring outcome (β^XY(m)=β^ZY(m)/β^ZX), and the causal effect of the exposure in the offspring on their own outcome (β^XY(f)=β^ZY(f)/β^ZX). It is important to realize that under this model, the same SNP-exposure association is being used to index both maternal and fetal exposures. While this may be appropriate in some circumstances (e.g., examining the effect of maternal and offspring IQ on offspring obesity in teenagers), it may not make sense for other exposures of interest (e.g., SNPs that index maternal smoking cannot index fetal smoking in utero). Investigators therefore need to think carefully about whether estimates of the offspring causal effect make sense in the particular context in which they are derived.
Figure 4.
Figure 4.
Structural equation modeling (SEM) used for the analysis of birth weight in Warrington et al. (2018). The squares represent observed variables in the analysis, in this particular case, the birth weight of the individual (BWM), the birth weight of her first offspring (BWO), and the genotype of the mother (GM). The circles represent latent variables in the analysis, that is, the genotype of the individual's mother (GG) and the genotype of the individual's offspring (GO). The total variance of the latent genotypes for the individual's mother (GG) and offspring (GO) and for the observed single-nucleotide polymorphism (SNP) variable is set equal to the estimated parameter Φ, that is, variance (GG) = Φ, variance (GM) = 0.75Φ + 0.25Φ, and variance (GO) = 0.75Φ + 0.25Φ as can be confirmed by path analysis. The βZY(m) and βZY(f) path coefficients refer to maternal and offspring genetic effects on birth weight, respectively (i.e., the association between maternal genotype and offspring birth weight conditional on offspring genotype, and the association between the offspring genotype and offspring birth weight conditional on maternal genotype). The residual error terms for the birth weight of the individual and their offspring are represented by ɛM and ɛO, respectively, and the variance of both of these terms is estimated in the SEM. The covariance between residual genetic and environmental sources of variation on birth weight is given by ρ. (Figure adapted from Warrington et al. 2018 with permission from the authors.)
Figure 5.
Figure 5.
The Mendelian randomization direction of the causation model (MR-DOC) illustrated as a path diagram for dizygotic (DZ) twins. Phenotypic variation and covariation between a polygenic risk score (PGS) and two observed phenotypes (X and Y) for twin one and twin two are decomposed into latent additive genetic (A), common environmental (C), and unique environmental (E) sources of variation (all latent variables are assumed to have mean zero and variance one). To assist with explication, correlational paths that contribute to within-twin, cross-trait covariances are displayed in red (dot dashes), correlational paths that contribute to cross-twin, within-trait covariances are shown in orange (long dashes), and correlational paths that contribute to cross-twin, cross-trait covariances are presented in green (short dashes). There are 13 potentially free parameters to be estimated in this model including the variance of the PGS [var(PGS)], the additive genetic, common environmental, and unique environmental path coefficients for variable X (ax, cx, ex) and variable Y (ay, cy, ey), the additive genetic, common environmental, and unique environmental correlations between variable X and Y (ra, rc, re), the direct effect of the PGS on variable X (b1) and variable Y due to pleiotropy (b2), and the causal effect of variable X on variable Y (g1). The covariance among the PGSs is equal to half the variance of the polygenic scores. For the model to be identified, some parameters must be constrained (e.g., re = 0), which may not be an accurate reflection of reality. The path model for monozygotic (MZ) twins is similar except the cross-twin, same-trait correlation between latent additive genetic sources of variation is set to one, the cross-twin, cross-trait correlation between latent additive genetic sources of variation is set to ra, and the covariance among the PGSs is equal to the variance of the PGSs. If there is no horizontal pleiotropy (i.e., b2 = 0), then both MR-DOC and standard MR analyses (i.e., MR using two-stage least squares, Wald ratio, etc.) should give unbiased estimates of the causal effect (g1). In contrast, if b2 ≠ 0, then standard MR analyses will be biased, whereas MR-DOC will produce unbiased estimates of g1 (assuming re = 0). (Figure based on data in Minică et al. 2018.)

References

    1. Bates TC, Maher BS, Medland SE, McAloney K, Wright MJ, Hansell NK, Kendler KS, Martin NG, Gillespie NA. 2018. The nature of nurture: using a virtual-parent design to test parenting effects on children's educational attainment in genotyped families. Twin Res Hum Genet 21: 73–83. 10.1017/thg.2018.11 - DOI - PubMed
    1. Bowden J, Davey Smith G, Burgess S. 2015. Mendelian randomization with invalid instruments: effect estimation and bias detection through Egger regression. Int J Epidemiol 44: 512–525. 10.1093/ije/dyv080 - DOI - PMC - PubMed
    1. Bowden J, Davey Smith G, Haycock PC, Burgess S. 2016. Consistent estimation in Mendelian randomization with some invalid instruments using a weighted median estimator. Genet Epidemiol 40: 304–314. 10.1002/gepi.21965 - DOI - PMC - PubMed
    1. Bowden J, Hemani G, Davey Smith G. 2018. Invited commentary: detecting individual and global horizontal pleiotropy in Mendelian randomization—a job for the humble heterogeneity statistic? Am J Epidemiol 187: 2681–2685. - PMC - PubMed
    1. Brumpton B, Sanderson E, Hartwig FP, Harrison S, Vie GÅ, Cho Y, Howe LD, Hughes A, Boomsma DI, Havdahl A, et al. 2019. Within-family studies for Mendelian randomization: avoiding dynastic, assortative mating, and population stratification biases. bioRxiv 602516. - PMC - PubMed

Publication types