. 2020 Apr 10;147(7):dev185348.
doi: 10.1242/dev.185348.

Physical interactions between Gsx2 and Ascl1 balance progenitor expansion versus neurogenesis in the mouse lateral ganglionic eminence

Affiliations

Physical interactions between Gsx2 and Ascl1 balance progenitor expansion versus neurogenesis in the mouse lateral ganglionic eminence

Kaushik Roychoudhury et al. Development. .

Abstract

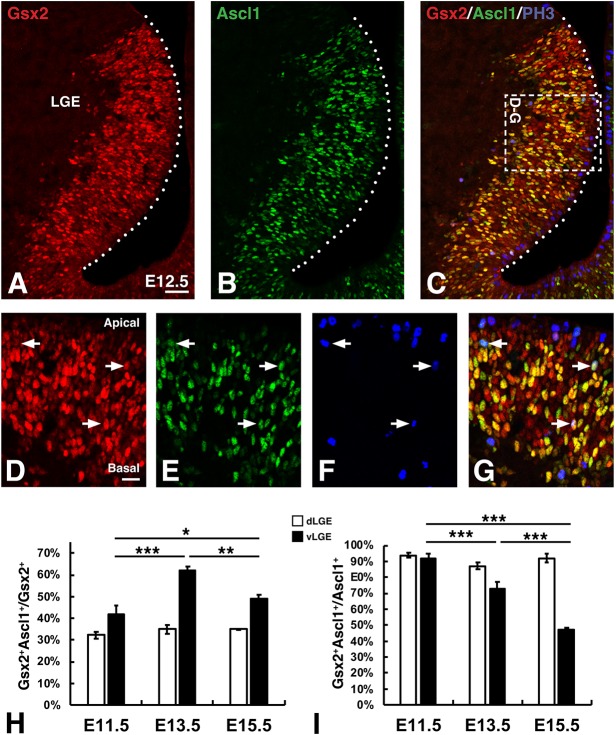
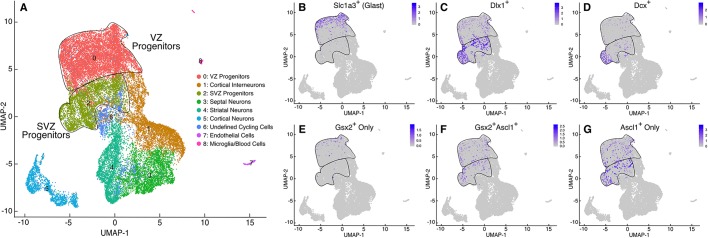
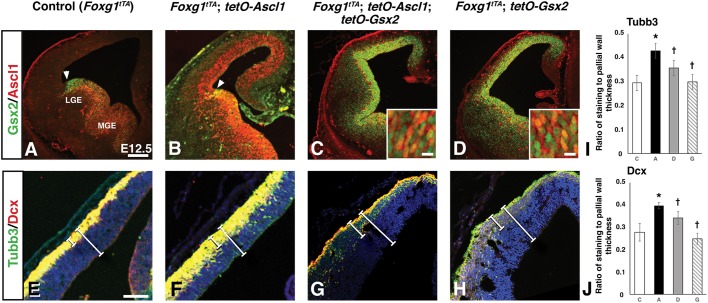
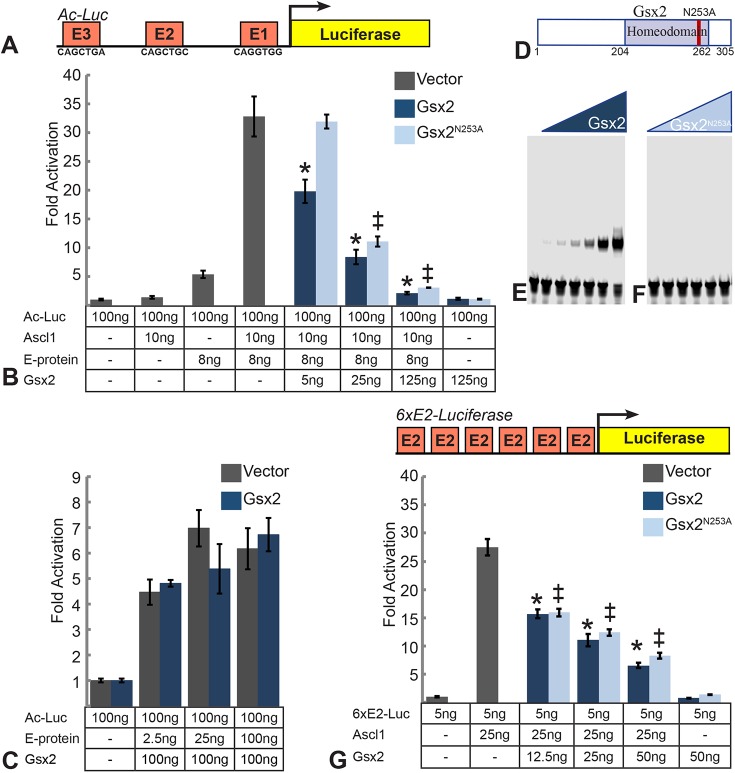
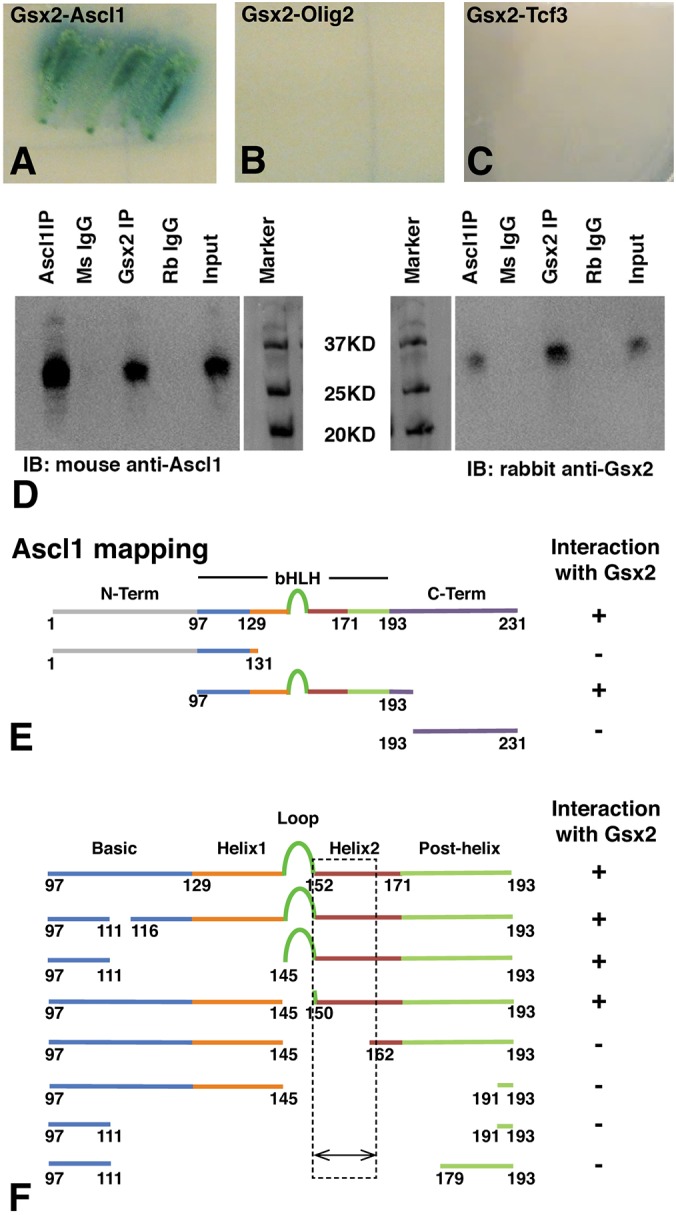
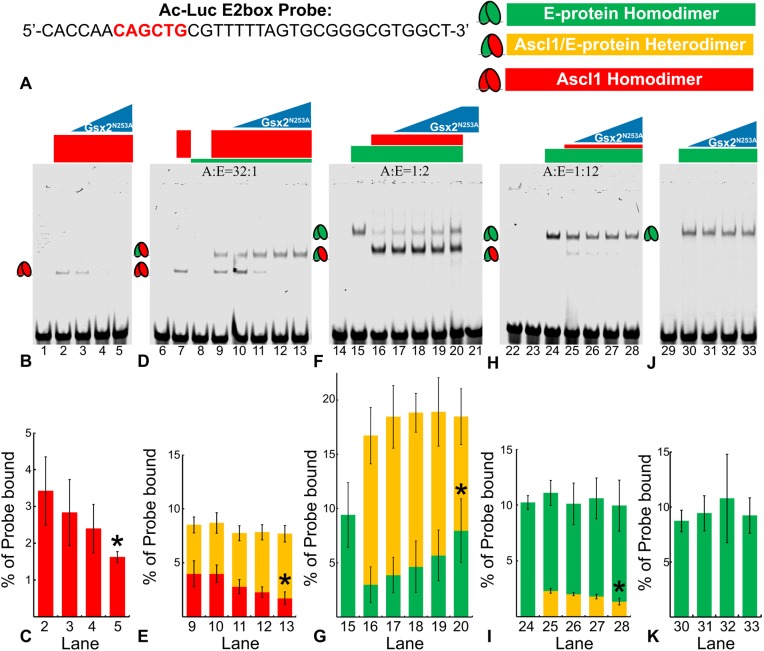
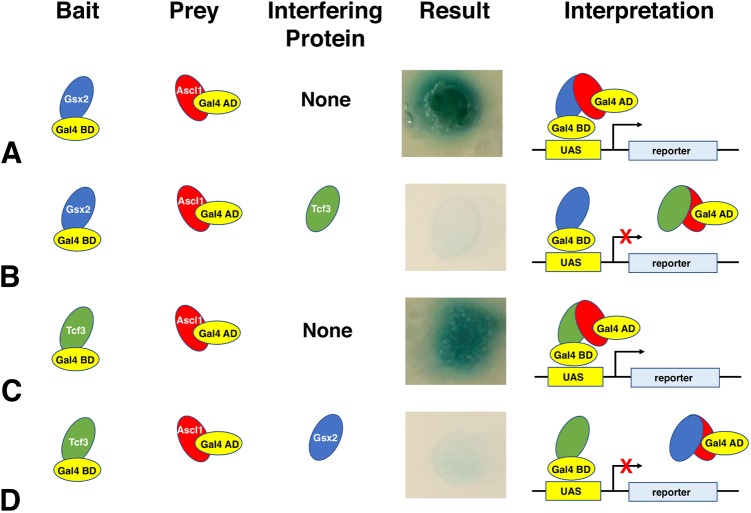
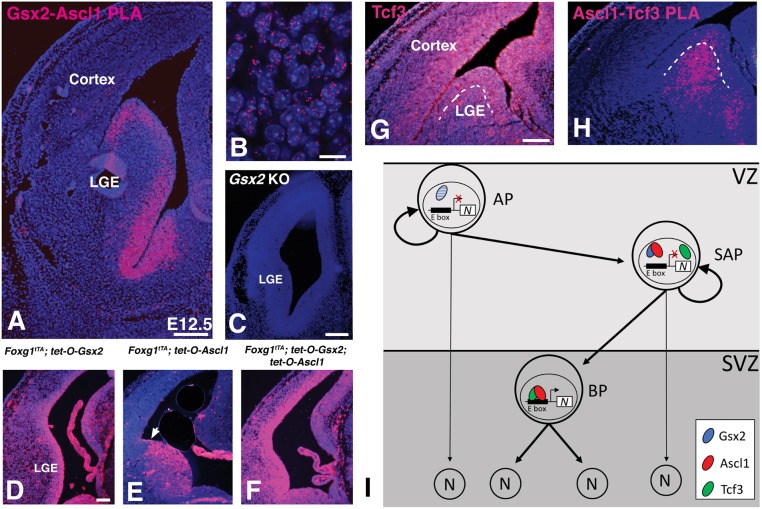
The Gsx2 homeodomain transcription factor promotes neural progenitor identity in the lateral ganglionic eminence (LGE), despite upregulating the neurogenic factor Ascl1. How this balance in maturation is maintained is unclear. Here, we show that Gsx2 and Ascl1 are co-expressed in subapical progenitors that have unique transcriptional signatures in LGE ventricular zone (VZ) cells. Moreover, whereas Ascl1 misexpression promotes neurogenesis in dorsal telencephalic progenitors, the co-expression of Gsx2 with Ascl1 inhibits neurogenesis. Using luciferase assays, we found that Gsx2 reduces the ability of Ascl1 to activate gene expression in a dose-dependent and DNA binding-independent manner. Furthermore, Gsx2 physically interacts with the basic helix-loop-helix (bHLH) domain of Ascl1, and DNA-binding assays demonstrated that this interaction interferes with the ability of Ascl1 to bind DNA. Finally, we modified a proximity ligation assay for tissue sections and found that Ascl1-Gsx2 interactions are enriched within LGE VZ progenitors, whereas Ascl1-Tcf3 (E-protein) interactions predominate in the subventricular zone. Thus, Gsx2 contributes to the balance between progenitor maintenance and neurogenesis by physically interacting with Ascl1, interfering with its DNA binding and limiting neurogenesis within LGE progenitors.

Keywords: E-protein; Proximity ligation assay; Subapical progenitor; Tcf3; Telencephalon.


Conflict of interest statement

Competing interestsThe authors declare no competing or financial interests.

Figures

Fig. 1.
Fig. 1.
Gsx2 and Ascl1 co-expression marks LGE subapical progenitors (SAPs). (A-G) Triple immunohistochemistry for Gsx2 (A,C,D,G), Ascl1 (B,C,E,G) and phosphohistone 3 (PH3) (C,F,G) in the E12.5 LGE. Box in C has been rotated 90° counterclockwise for the images in D-G. Note that most APs (i.e. PH3+ cells at the apical surface indicated by dotted lines in A-C or positioned at the top of D-G) express low or undetectable levels of either Gsx2 or Ascl1 (C,G). In contrast, PH3+ cells at abventricular positions (i.e. SAPs) within the VZ frequently colocalize Gsx2 and Ascl1 (D-G). (H,I) Quantification of Gsx2+Ascl1+ co-expressing cells in the dLGE (white bars) versus vLGE (black bars) as either a ratio of the Gsx2+ (H) or Ascl1+ (I) cells from the embryonic stages shown in Fig. S1. Data shown in H and I represent the mean±s.d. (n=3). Note, a small but significant (P<0.05) difference was detected in the Gsx2+Ascl1+/Ascl1+ cells of the dLGE at E13.5 (H). One-way ANOVA was performed between the dLGE or the vLGE data at each embryonic stage with a Tukey's HSD post-hoc. *P<0.05, **P<0.01 and ***P<0.001. Scale bars: 50 µm (A-C); 20 µm (D-G).
Fig. 2.
Fig. 2.
Single cell transcriptome analysis of Gsx2+ and Ascl1+ progenitors show progressive maturation of LGE progenitors. (A) UMAP plot of distinct cell types identified from E12.5 ventral telencephalon cells. Clusters with characteristics of VZ and SVZ progenitors (i.e. clusters 0 and 2, respectively) are outlined and labeled. (B-D) Feature plots showing cells expressing the VZ marker Slc1a3 (Glast) (B), the SVZ-enriched Dlx1 (C) and the neuronal marker Dcx (D). (E-G) Feature plots showing Gsx2+ only (E), Gsx2+Ascl1+ (F) and Ascl1+ only (G) LGE cells within the progenitor compartments. Note that Gsx2+-only cells correlate well with those expressing the VZ radial glial marker Slc1a3 (Glast) (B,E), whereas the double-labeled cells and Ascl1+-only cells correlate best with the SVZ marker Dlx1 (C,F,G). Moreover, the Ascl1+-only cells correlate best with the neurogenic (i.e. Dcx+) cells (D,G).
Fig. 3.
Fig. 3.
Gsx2 inhibits Ascl1-driven neurogenesis in a transgenic misexpression assay. (A-H) Coronal sections through the telencephalon of E12.5 control (i.e. Foxg1tTA) (A,E), Ascl1-misexpressing (i.e. Foxg1tTA; tetO-Ascl1) (B,F), Gsx2- and Ascl1-misexpressing (i.e. Foxg1tTA; tetO-Ascl1; tetO-Gsx2) (C,G) and Gsx2-misexpressing (i.e. Foxg1tTA; tetO-Gsx2) (D,H) embryos. (B) Misexpression of Ascl1 throughout the telencephalon did not alter Gsx2 expression, stopping at the pallio-subpallial boundary (indicated by arrowheads) as in controls (A). Misexpression of Ascl1 within the dorsal telencephalon did, however, lead to an increase in Tubb3 and Dcx staining (compare F with E). Insets in C and D represent high power views of the dorsal telencephalon VZ showing broad co-expression of Gsx2 and Ascl1. E and F were counterstained with DAPI. Misexpression of Gsx2 alone upregulated Ascl1 throughout the telencephalon (D) and reduced neurogenesis (H), which was similar to misexpression of both Gsx2 and Ascl1 (C,G). (I,J) Quantification was carried out by measuring the Tubb3/Dcx-positive cortical staining (smaller white bar) and represented as a ratio of the total pallial wall (larger white bar). Data presented in I (Tubb3) and J (Dcx) represent mean±s.d. for each genotype (C, control, n=3; A, Ascl1 misexpression, n=3; D, Gsx2 and Ascl1 misexpression, n=3; G, Gsx2 misexpression, n=3). One-way ANOVA was performed between the data from C (Control), A (Ascl1-misexpression), D (double-misexpression) and G (Gsx2-misexpression) embryos with a Tukey's HSD post hoc. *P<0.05 as compared to C and †P<0.01 as compared with A misexpressing embryos. Scale bars: 200 µm [A-D; insets: 10 µm (C,D)]; 100 µm (E-H).
Fig. 4.
Fig. 4.
Gsx2 interferes with Ascl1-mediated reporter activation independent of its ability to bind DNA. (A) Schematic of the luciferase reporter construct used in B and C. The promoter of the Drosophila acheate gene contains three E-box sequences that can be bound by Ascl1 (Fig. S2). (B) Luciferase assay in S2 cells using the Ac-Luc reporter cotransfected with the indicated amounts of Ascl1, Drosophila E-protein (Daughterless) and Gsx2. Values represent fold activation over the Ac-Luc reporter added alone. Effects of co-transfecting an empty pAC5.1 expression vector, Gsx2 wild type, and Gsx2 DNA binding mutant (N253A) are shown. (C) 100 ng of Ac-Luc reporter was co-transfected with the indicated amount of Drosophila E-protein with 100 ng of wild-type Gsx2. Values represent fold activation over the Ac-Luc reporter added alone. (D) Schematic of the Gsx2 protein indicating the homeodomain and the position of the amino acid mutated to disrupt DNA binding. (E,F) Equimolar amounts of Gsx2 (E) and Gsx2N253A (F) were added to probes containing a predicted high affinity Gsx2 binding site. Note the complete loss of DNA binding with the Gsx2N253A protein. (G) Schematic of the Luciferase reporter construct containing six copies of an E-box with the sequence CAGCTG. This 6xE2box reporter (5 ng) was co-transfected into the mouse mK4 cell line with 25 ng Ascl1 and the indicated amount of Gsx2. Values represent fold activation over reporter alone. For luciferase assays, all conditions were performed in triplicate and normalized to a Renilla luciferase transfection control. Data represent means±s.d. In B and G, a one-way ANOVA was performed between vector, Gsx2 and Gsx2N253A with a Tukey's HSD post-hoc test. * indicates significant difference (P<0.01) between transfection of empty vector and Gsx2 WT. ‡ indicates significant difference (P<0.01) between transfection of empty vector and Gsx2N253A. In C, an unpaired, two-tailed Student's t-test was performed between the results from vector and Gsx2 for each condition.
Fig. 5.
Fig. 5.
Gsx2 physically interacts with the bHLH domain of Ascl1 in the mouse telencephalon. (A-C) Yeast two-hybrid experiments using either Gsx2 as bait and Ascl1 (A), Olig2 (B), or Tcf3 as prey (C). Note robust reporter gene expression (i.e. α-gal) was only observed in the Gsx2-Ascl1 experiment (A). (D) Co-IP experiments using lysates from E12.5 mouse telencephalon. Pulling down Gsx2 with a rabbit antibody and blotting with a mouse Ascl1 antibody showed association of Ascl1 with Gsx2. Conversely, pulling down Ascl1 and blotting with a Gsx2 antibody showed association of these two proteins in the embryonic mouse telencephalon. Rabbit (Rb) IgG and mouse (Ms) IgG were used as controls for the Gsx2 and Ascl1 pull downs, respectively, and the input lane contained 10% input. (E) Using truncated portions of Ascl1 (e.g. N-Terminal, bHLH and C-Terminal) in a yeast two-hybrid assay, we found that only the bHLH domain of Ascl1 interacts with Gsx2. (F) Further deletion mapping studies using the yeast two-hybrid assay showed that the second helix (amino acids 150-162) of Ascl1 is required for interactions with Gsx2. See Fig. S2 for detailed amino acid deletions.
Fig. 6.
Fig. 6.
Gsx2 interferes with Ascl1 homodimer and heterodimer binding to an E-box DNA sequence. (A) Sequence of the E-box (highlighted in red) probe used in lanes 1-33 of EMSAs shown in B-K. (B) Gsx2 DNA binding mutant, Gsx2N253A, is titrated in increasing amounts from 0 to 80 pmoles in samples containing a constant 2.5 pmoles of Ascl1. (C) Percentage of probe bound by Ascl1-Ascl1 homodimers (red bars) in lanes 2-5. (D) Ascl1 (2.5 pmoles) and E-protein (0.08 pmoles) were added in a 32:1 ratio in each lane (9-13) with increasing levels of Gsx2N253A from 0 to 80 pmoles. (E) Percentage of probe bound by Ascl1-Ascl1 homodimers (red) and Ascl1-E47 heterodimers (yellow) in lanes 9-13. (F) Ascl1 (0.15 pmoles) and E-protein (0.3 pmoles) were added in a 1:2 ratio in each lane (16-20) with increasing levels of Gsx2N253A from 0 to 80 pmoles. (G) Percentage of probe bound by Ascl1-E47 heterodimers (yellow) and E47-E47 homodimers (green) in lanes 15-20. (H) Ascl1 (0.026 pmoles) and E-protein (0.31 pmoles) were added in a 1:12 ratio in each lane (25-28) with increasing levels of Gsx2N253A from 0 to 80 pmoles. (I) Percentage of probe bound by Ascl1-E47 heterodimers (yellow), and E47-E47 homodimers (green) in lanes 24-28. (J) E-protein (0.3 pmoles) was added to each lane (30-33) with increasing levels of Gsx2N253A from 0 to 80 pmoles. (K) Percentage of probe bound by E47-E47 homodimers (green) in lanes 30-33. Each EMSA was performed in triplicate, and data in C,E,G,I,K represent mean±s.d. with the intensity of bands representing each complex normalized to total probe intensity. Note, the y axes in C,E,G,I,K are different scales in order to accentuate the relative changes. An unpaired, two-tailed Student's t-test was performed between the no Gsx2N253A condition and the maximum Gsx2N253A condition, *P<0.05.
Fig. 7.
Fig. 7.
Gsx2 and Tcf3 compete for molecular interactions with Ascl1 in a yeast three-hybrid assay. The yeast three-hybrid assay utilizes an interfering protein that is capable of interacting with the bait or the prey to disrupt their interaction. (A) Using Gsx2 as bait and Ascl1 as prey, with no interfering protein, results in reporter (α-gal) expression, whereas the addition of Tcf3 (E-protein) as an interfering protein disrupts the interaction as shown in B. (C) Likewise, with Tcf3 as bait and Ascl1 as prey, and no interfering protein, α-gal expression is activated, which is disrupted by the addition of Gsx2 as the interfering protein as seen in D.
Fig. 8.
Fig. 8.
Proximity ligation assay (PLA) shows Ascl1-Gsx2 interactions and Ascl1-Tcf3 interactions in a distinct portion of the LGE germinal zone. (A) When PLA was performed using rabbit anti-Gsx2 and guinea pig anti-Ascl1 antibodies, a strong signal (magenta) was detected in the LGE and septal VZ. (B) High power magnification of the VZ region shows a punctate signal associated with the DAPI-stained nuclei. (C) The PLA signal between Gsx2 and Ascl1 antibodies was specific as no signal was detected in Gsx2 knockout (KO) tissue sections. (D) In Gsx2-misexpressing embryos, PLA signal is expanded throughout the telencephalon as is the case for Gsx2 and Ascl1 expression. (E) PLA signal is not expanded throughout the telencephalon in the Ascl1-misexpressing embryos (pallio-subpallial boundary indicated by arrow in E as Gsx2 is not upregulated outside of the ventral telencephalon (Fig. 2B). However, the PLA signal is intensified in the ventral telencephalon. (F) Misexpression of both Gsx2 and Ascl1 leads to increased PLA signal throughout the telencephalon. (G) Immunostaining for Tcf3 protein in the E12.5 telencephalon shows staining throughout the germinal zones including both the VZ and SVZ. (H) PLA using the goat anti-Tcf3 and guinea pig anti-Ascl1 antibodies shows signal in both the LGE VZ as well as the SVZ, with stronger signal in the latter region. The boundary between the VZ and SVZ is indicated by the dashed line in G and H. (I) Schematic model showing LGE progenitor subtypes, with SAPs co-expressing Gsx2 and Ascl1 thus limiting Ascl1's neurogenic function and allowing for progenitor expansion. Gsx2 expression is lost in BPs, allowing Ascl1:Tcf3 heterodimers to drive direct neurogenesis. Note that Gsx2 was observed in some APs (indicated by blue hatching) but not together with Ascl1. In this model, both APs and SAPs could undergo direct neurogenesis if Gsx2 was downregulated (indicated by thin arrows). Scale bars:100 µm (A); 10 µm (B); 200 µm (C); 100 µm (D-H). N, neuron.

Similar articles

Cited by

References

    1. Bagchi S., Fredriksson R. and Wallén-Mackenzie Å. (2015). In situ proximity ligation assay (PLA). Methods Mol. Biol. 1318, 149-159. 10.1007/978-1-4939-2742-5_15 - DOI - PubMed
    1. Berger M. F., Badis G., Gehrke A. R., Talukder S., Philippakis A. A., Peña-Castillo L., Alleyne T. M., Mnaimenh S., Botvinnik O. B., Chan E. T. et al. (2008). Variation in homeodomain DNA binding revealed by high-resolution analysis of sequence preferences. Cell 133, 1266-1276. 10.1016/j.cell.2008.05.024 - DOI - PMC - PubMed
    1. Bhide P. G. (1996). Cell cycle kinetics in the embryonic mouse corpus striatum. J. Comp. Neurol. 374, 506-522. 10.1002/(SICI)1096-9861(19961028)374:4<506::AID-CNE3>3.0.CO;2-5 - DOI - PubMed
    1. Butler A., Hoffman P., Smibert P., Papalexi E. and Satija R. (2018). Integrating single-cell transcriptomic data across different conditions, technologies, and species. Nat. Biotechnol. 36, 411-420. 10.1038/nbt.4096 - DOI - PMC - PubMed
    1. Castro D. S., Martynoga B., Parras C., Ramesh V., Pacary E., Johnston C., Drechsel D., Lebel-Potter M., Garcia L. G., Hunt C. et al. (2011). A novel function of the proneural factor Ascl1 in progenitor proliferation identified by genome-wide characterization of its targets. Genes. Dev. 25, 930-945. 10.1101/gad.627811 - DOI - PMC - PubMed

Publication types

MeSH terms

Substances