

Neurologic syndromes related to anti-GAD65: Clinical and serologic response to treatment
- PMID: 32123047
- PMCID: PMC7136051
- DOI: 10.1212/NXI.0000000000000696
Neurologic syndromes related to anti-GAD65: Clinical and serologic response to treatment
Erratum in
-
Neurologic syndromes related to anti-GAD65: Clinical and serologic response to treatment.Neurol Neuroimmunol Neuroinflamm. 2020 Apr 15;7(4):e733. doi: 10.1212/NXI.0000000000000733. Print 2020 Jul. Neurol Neuroimmunol Neuroinflamm. 2020. PMID: 32295823 Free PMC article. No abstract available.
-
Neurologic Syndromes Related to Anti-GAD65: Clinical and Serologic Response to Treatment.Neurol Neuroimmunol Neuroinflamm. 2024 Mar;11(2):e200215. doi: 10.1212/NXI.0000000000200215. Epub 2024 Feb 5. Neurol Neuroimmunol Neuroinflamm. 2024. PMID: 38315937 Free PMC article. No abstract available.
Abstract
Objective: Antibodies against glutamic acid decarboxylase 65 (anti-GAD65) are associated with a number of neurologic syndromes. However, their pathogenic role is controversial. Our objective was to describe clinical and paraclinical characteristics of anti-GAD65 patients and analyze their response to immunotherapy.
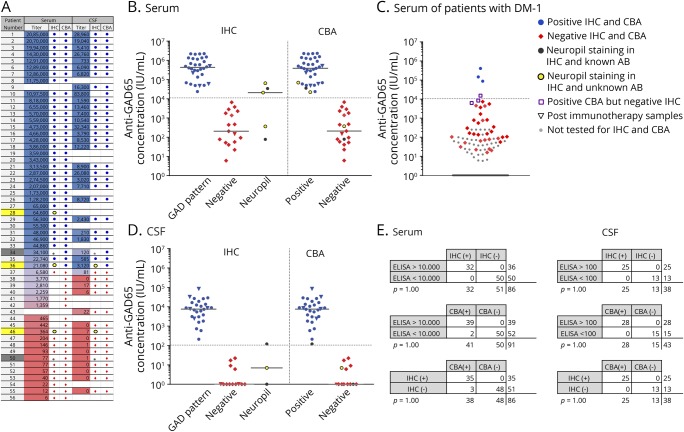
Methods: Retrospectively, we studied patients (n = 56) with positive anti-GAD65 and any neurologic symptom. We tested serum and CSF with ELISA, immunohistochemistry, and cell-based assay. Accordingly, we set a cutoff value of 10,000 IU/mL in serum by ELISA to group patients into high-concentration (n = 36) and low-concentration (n = 20) groups. We compared clinical and immunologic features and analyzed response to immunotherapy.
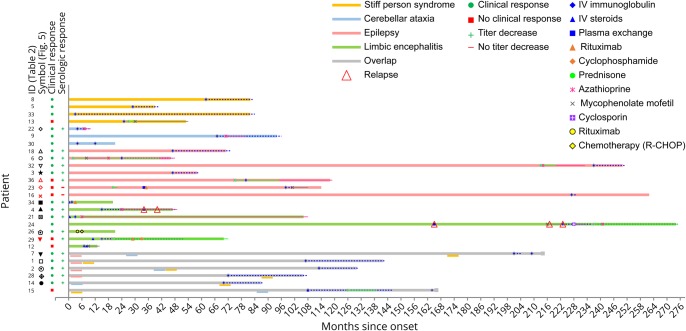
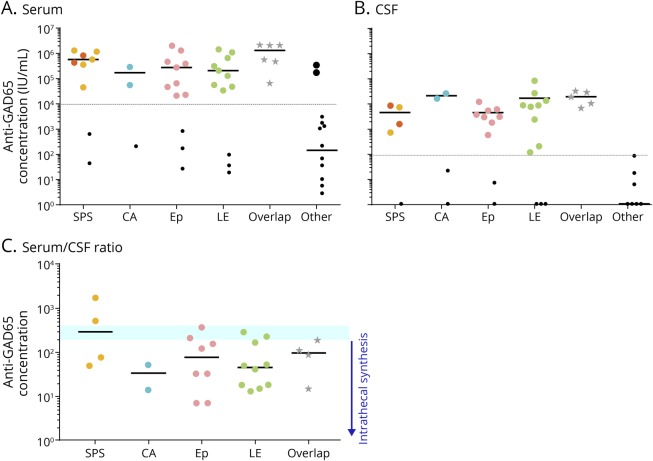
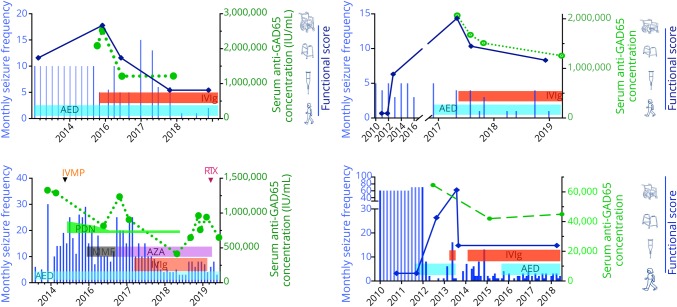
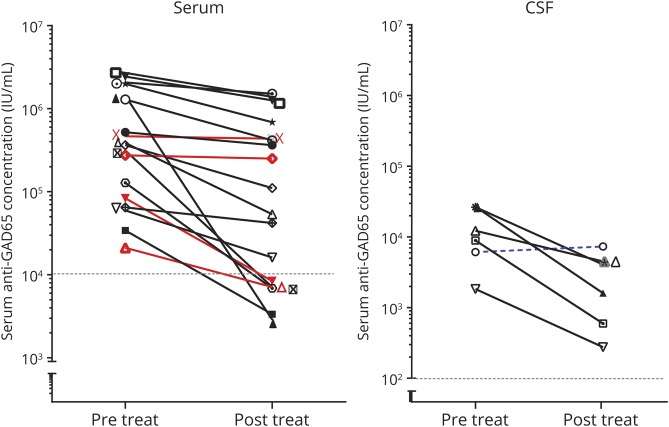
Results: Classical anti-GAD65-associated syndromes were seen in 34/36 patients with high concentration (94%): stiff-person syndrome (7), cerebellar ataxia (3), chronic epilepsy (9), limbic encephalitis (9), or an overlap of 2 or more of the former (6). Patients with low concentrations had a broad, heterogeneous symptom spectrum. Immunotherapy was effective in 19/27 treated patients (70%), although none of them completely recovered. Antibody concentration reduction occurred in 15/17 patients with available pre- and post-treatment samples (median reduction 69%; range 27%-99%), of which 14 improved clinically. The 2 patients with unchanged concentrations showed no clinical improvement. No differences in treatment responses were observed between specific syndromes.
Conclusion: Most patients with high anti-GAD65 concentrations (>10,000 IU/mL) showed some improvement after immunotherapy, unfortunately without complete recovery. Serum antibody concentrations' course might be useful to monitor response. In patients with low anti-GAD65 concentrations, especially in those without typical clinical phenotypes, diagnostic alternatives are more likely.
Copyright © 2020 The Author(s). Published by Wolters Kluwer Health, Inc. on behalf of the American Academy of Neurology.
Figures
Comment in
-
How Much GAD65 Do You Have? High Levels of GAD65 Antibodies in Autoimmune Encephalitis.Epilepsy Curr. 2020 Aug 25;20(5):267-270. doi: 10.1177/1535759720949238. eCollection 2020 Sep-Oct. Epilepsy Curr. 2020. PMID: 34025238 Free PMC article. No abstract available.
References
-
- Solimena M, de Camilli P, Blake R, et al. . Autoimmunity to glutamic acid decarboxylase (GAD) in Stiff-Man syndrome and insulin-dependent diabetes mellitus. Trends Neurosci 1991;14:452–457. - PubMed
-
- Sigurdsson E, Baekkeskov S. The 64-kDa beta cell membrane autoantigen and other target molecules of humoral autoimmunity in insulin-dependent diabetes mellitus. Curr Top Microbiol Immunol 1990;164:143–168. - PubMed
-
- Giometto B, Miotto D, Faresin F, Argentiero V, Scaravilli T, Tavolato B. Anti-GABAergic neuron autoantibodies in a patient with stiff-man syndrome and ataxia. J Neurol Sci 1996;143:57–59. - PubMed
-
- Peltola J, Kulmala P, Isojärvi J, et al. . Autoantibodies to glutamic acid decarboxylase in patients with therapy-resistant epilepsy. Neurology 2000;55:46–50. - PubMed
-
- Honnorat J, Saiz A, Giometto B, et al. . Cerebellar ataxia with anti–glutamic acid decarboxylase antibodies. Arch Neurol 2001;58:225. - PubMed