. 2020 Mar 2;10(1):3783.
doi: 10.1038/s41598-020-60220-1.

Statistical Tests for Force Inference in Heterogeneous Environments

Affiliations

Statistical Tests for Force Inference in Heterogeneous Environments

Alexander S Serov et al. Sci Rep. .

Abstract

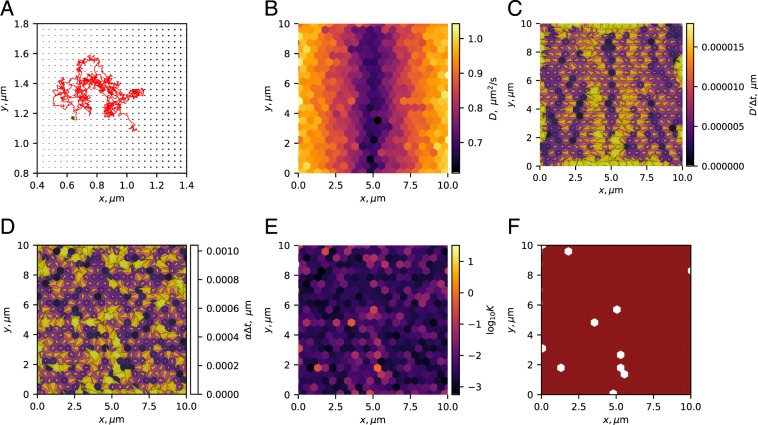
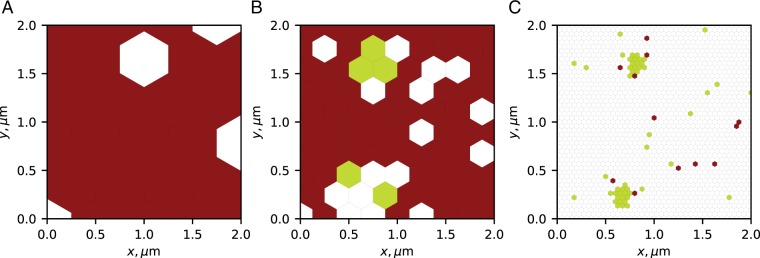
We devise a method to detect and estimate forces in a heterogeneous environment based on experimentally recorded stochastic trajectories. In particular, we focus on systems modeled by the heterogeneous overdamped Langevin equation. Here, the observed drift includes a "spurious" force term when the diffusivity varies in space. We show how Bayesian inference can be leveraged to reliably infer forces by taking into account such spurious forces of unknown amplitude as well as experimental sources of error. The method is based on marginalizing the force posterior over all possible spurious force contributions. The approach is combined with a Bayes factor statistical test for the presence of forces. The performance of our method is investigated analytically, numerically and tested on experimental data sets. The main results are obtained in a closed form allowing for direct exploration of their properties and fast computation. The method is incorporated into TRamWAy, an open-source software platform for automated analysis of biomolecule trajectories.


Conflict of interest statement

The authors declare no competing interests.

Figures

Figure 1
Figure 1
(A) Marginalized Bayes factor KM for the presence of forces in a 2D system as a function of the signal-to-noise ratios ζsp and ζ (see text). Black lines show the Bayes factor levels log10KM=1 (solid) and log10KM=1 (dashed). Gray lines mark levels of Bayes factor for log10KM10. The color map shows Bayes factor values for log10KM1. KM behavior is qualitatively similar for other parameter values. (B) Force posteriors for a 2D system with ζsp = 0.1 and ζt = 0. Posterior distributions obtained for Itô (dashed blue line), Stratonovich (dashed green), Hänggi (dashed orange) and marginalized (solid magenta) approaches are shown alongside their common prior (dotted black). In both panels, the number of recorded displacements is n = 500, the prior hyperparameter u = 1.0, the perpendicular component of the total force ζt = 0, and the localization error σL2=0.
Figure 2
Figure 2
(A) A diffusivity map inferred using the TRamWAy software platform. The white line y = 0.5 μm indicates the axis along which the diffusivity profile is plotted in (B). (B) 1D diffusivity profile showing the true diffusivity (solid blue line) and D values inferred from a single simulation (magenta crosses). Error bars show 95% confidence intervals (CI) calculated from the diffusivity posterior (see Appendix A1). (C,D) Inferred values of the marginalized Bayes factor log10K^M as a function of its expected value: sliding average (solid green line) over a window of constant width 0.5 on the logarithmic scale and the corresponding 95% CI (shaded green region). The observed dependency is centered around the identity line (K^M=KM, dashed orange) indicating that the inferred Bayes factors are approximately unbiased for both the case when the total force is parallel to the spurious force (ζt = 0, (C)) and when it is not (ζt = 0.11, (D)). The Bayes factors were inferred in individual domains shown in (A), with an average of ~123 individual domains per trial. In each trial, the spatial tessellation was performed independently based on the relative particle density. The calculations were repeated across 100 trials for each value of ζ out of the analyzed range (see Appendix A6).
Figure 3
Figure 3
Simulations of mesoscopic changes in particle diffusivity due to microscopic crowding. Inference results for particles diffusing in the presence of a lattice of immobile beads of various radius. (A) A zoom-in on a small 1 × 1 μm2 section of the simulated 10 × 10 μm2 system. The radius of the immobilized beads located in the nodes of a lattice changes with x leading to an effective diffusivity gradient on a larger scale (cf. (B,C). A sample trajectory of 1000 jumps of a single diffusing particle, with a green circle indicating the origin point. In total, 1000 independent diffusing particles were simulated. (B) Inferred diffusivity. (C) Inferred diffusivity gradient. Arrows indicate the direction and the strength of the gradient, also represented by the bin color. (D) Inferred drift. Arrows indicate the direction and the strength of the drift, also represented by the bin color. (E) Estimated Bayes factor. (F) Thresholded Bayes factor. Color code: green (non-spurious force, log10K1), red (spurious force only, log10K1), white (insufficient evidence, log10K<1). Values of D, D and α in the plots (BD) were clipped at high values around the 9th decile to allow for a clearer visualization. Simulation details are provided in Appendix A7.
Figure 4
Figure 4
(AC) Bayes factors for the presence of non-spurious forces inferred from experimentally-recorded trajectories of a bead trapped in the optical tweezers at 3 different levels of laser power: (A) 500 mW, (B) 251 mW, (C) 138 mW. For a better visual representation, all values of log10KM>3 (very strong evidence for H1) are shown as log10KM=3. Each domain contained strictly between 390 and 410 recorded displacements. (DI) Bayes factors analysis for single-molecule-dynamics of the Gag protein during the assembly of HIV VLPs in human T cells. (DI) All panels show the same 2 μm × 2 μm patch of a T cell membrane. (D) 1000 trajectories randomly chosen among the 12 825 trajectories of the data set. (E) Number of displacements n attributed to each domain. (F) Common logarithm of the marginalized Bayes factor KM. Note the high values of log10KM where Gag particles cluster. (G) Inferred diffusivity field. (H) Absolute value of the inferred diffusivity gradient. (I) Absolute value of the inferred total force. In panels (H,I), large values have been clipped around the 9th decile to increase plot readability.
Figure 5
Figure 5
Thresholded Bayes factors for the VLP data set inferred at three different spatial scales. The average distance between bins was set to 0.5 μm (A), 0.25 μm (B), 0.05 μm (C). Panel (C) demonstrates the same mesh as in Fig. 4D–I. Color code: green — non-spurious force, log10K1; red — only spurious force, log10K1; white — insufficient evidence, log10K<1.

References

    1. Wachsmuth, M., Waldeck, W. & Langowski, J. Anomalous Diffusion of Fluorescent Probes inside Living Cell Investigated by Spatially-Resolved Fluorescence Correlation Spectroscopy. J. Mol. Biol. 298, 677–689, ISSN: 00222836 (2000). - PubMed
    1. Best, R. B. & Hummer, G. Diffusion Models of Protein Folding. Phys. Chem. Chem. Phys. 13, 16902, ISSN: 1463-9076 (2011). - PMC - PubMed
    1. Vestergaard, C. L., Blainey, P. C. & Flyvbjerg, H. Single-Particle Trajectories Reveal Two-State Diffusion-Kinetics of hOGG1 Proteins on DNA. Nucleic Acids Res. 46, 2446–2458, ISSN: 1362-4962 (2018). - PMC - PubMed
    1. Etoc Fred, Balloul Elie, Vicario Chiara, Normanno Davide, Liße Domenik, Sittner Assa, Piehler Jacob, Dahan Maxime, Coppey Mathieu. Non-specific interactions govern cytosolic diffusion of nanosized objects in mammalian cells. Nature Materials. 2018;17(8):740–746. doi: 10.1038/s41563-018-0120-7. - DOI - PubMed
    1. Dahan M. Diffusion Dynamics of Glycine Receptors Revealed by Single-Quantum Dot Tracking. Science. 2003;302(5644):442–445. doi: 10.1126/science.1088525. - DOI - PubMed

Publication types