Randomized Controlled Trial
. 2020 Mar 2;10(1):3785.
doi: 10.1038/s41598-020-60286-x.

Exercise training results in depot-specific adaptations to adipose tissue mitochondrial function

Affiliations
Randomized Controlled Trial

Exercise training results in depot-specific adaptations to adipose tissue mitochondrial function

Amy E Mendham et al. Sci Rep. .

Abstract

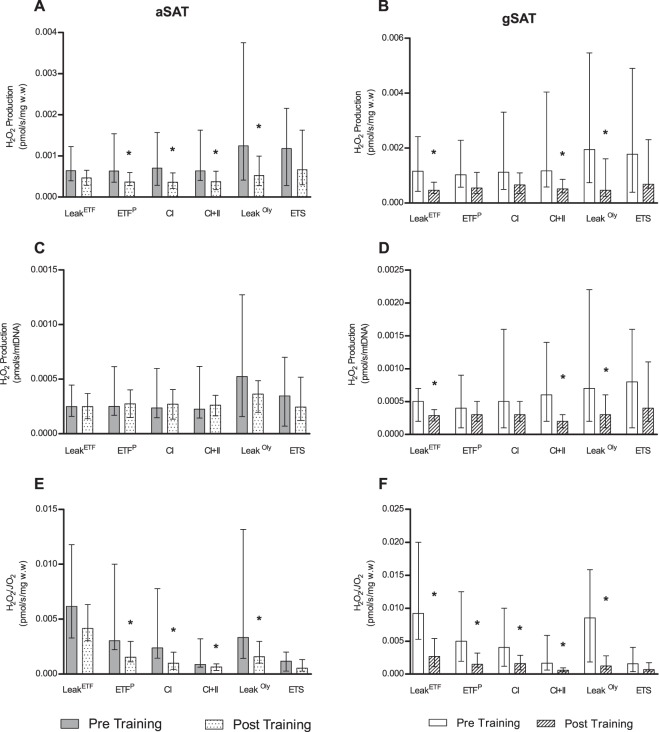
We assessed differences in mitochondrial function in gluteal (gSAT) and abdominal subcutaneous adipose tissue (aSAT) at baseline and in response to 12-weeks of exercise training; and examined depot-specific associations with body fat distribution and insulin sensitivity (SI). Obese, black South African women (n = 45) were randomized into exercise (n = 23) or control (n = 22) groups. Exercise group completed 12-weeks of aerobic and resistance training (n = 20), while the control group (n = 15) continued usual behaviours. Mitochondrial function (high-resolution respirometry and fluorometry) in gSAT and aSAT, SI (frequently sampled intravenous glucose tolerance test), body composition (dual-energy X-ray absorptiometry), and ectopic fat (MRI) were assessed pre- and post-intervention. At baseline, gSAT had higher mitochondrial respiratory capacity and hydrogen peroxide (H2O2) production than aSAT (p < 0.05). Higher gSAT respiration was associated with higher gynoid fat (p < 0.05). Higher gSAT H2O2 production and lower aSAT mitochondrial respiration were independently associated with lower SI (p < 0.05). In response to training, SI improved and gynoid fat decreased (p < 0.05), while H2O2 production reduced in both depots, and mtDNA decreased in gSAT (p < 0.05). Mitochondrial respiration increased in aSAT and correlated with a decrease in body fat and an increase in soleus and hepatic fat content (p < 0.05). This study highlights the importance of understanding the differences in mitochondrial function in multiple SAT depots when investigating the pathophysiology of insulin resistance and associated risk factors such as body fat distribution and ectopic lipid deposition. Furthermore, we highlight the benefits of exercise training in stimulating positive adaptations in mitochondrial function in gluteal and abdominal SAT depots.


Conflict of interest statement

The authors declare no competing interests.

Figures

Figure 1
Figure 1
Baseline comparisons of mitochondrial respiration (A,B) and H2O2 production (CE) between abdominal and gluteal subcutaneous adipose tissue. All data is reported as median (25–75% Interquartile Range). Paired t-tests identified differences at baseline between depots (n = 37). Significant difference between abdominal and gluteal depots *p < 0.05; **p < 0.001. LeakETF, leak respiration through electron-transferring flavoprotein; ETFP, Lipid oxidative phosphorylation capacity; CI, Complex 1 linked respiration; CI + CII, Complex 1 and 2 linked respiration (oxidative phosphorylation capacity); LeakOly, Oligomycin (ATP synthase inhibitor) linked leak respiration; ETS, Electron transfer system capacity; ETSII, Complex 2 linked electron transfer system capacity.
Figure 2
Figure 2
Change in mitochondrial respiration in response to a 12-week exercise training intervention. (A,C) represent change in abdominal subcutaneous adipose tissue (aSAT). (B,D) represent change in gluteal SAT (gSAT). All data reported as median (25–75% Interquartile Range). Mixed-model analyses identified main time (pre and post), group (exercise and control), and interaction (group x time) effects in exercise (n = 19, both depots) and control (n = 14 in abdominal and n = 13 in gluteal depots) groups. Significant difference between pre and post exercise training *p < 0.05. LeakETF, leak respiration through electron-transferring flavoprotein; ETFP, Lipid oxidative phosphorylation capacity; CI, Complex 1 linked respiration; CI + CII, Complex 1 and 2 linked respiration (oxidative phosphorylation capacity); LeakOly, Oligomycin (ATP synthase inhibitor) linked leak respiration; ETS, Electron transfer system capacity; ETSII, Complex 2 linked electron transfer system capacity.
Figure 3
Figure 3
Change in mitochondrial H2O2 production in response to a 12-week exercise training intervention. (A,C,E) represent change in abdominal subcutaneous adipose tissue (aSAT). (B,D,F) represent change in gluteal SAT (gSAT). Mixed-model analyses identified main time (pre and post), group (exercise and control), and interaction (group x time) effects in exercise (n = 19, both depots) and control (n = 14 in abdominal and n = 13 in gluteal depots) groups. All data reported as median (25–75% Interquartile Range). Significant difference between pre and post exercise training *p < 0.05. LeakETF, leak respiration through electron-transferring flavoprotein; ETFP, Lipid oxidative phosphorylation capacity; CI, Complex 1 linked respiration; CI + CII, Complex 1 and 2 linked respiration (oxidative phosphorylation capacity); LeakOly, Oligomycin (ATP synthase inhibitor) linked leak respiration; ETS, Electron transfer system capacity.
Figure 4
Figure 4
Baseline correlations on abdominal (aSAT) and gluteal (gSAT) subcutaneous adipose tissue mitochondrial oxygen flux, adjusted for mg w.w with body fat distribution (A–D), insulin sensitivity (E) and tissue specific gene expression of glucose transporter 4 (GLUT4) (F). All data not normally distributed and transformed prior to Pearson correlations. All data is pooled for graphical purposes and correlations were conducted on mitochondrial respiration in each depot. Sample numbers include, n = 38 (A,B,F) and n = 36 (C,D,E) in aSAT; n = 40 (A,B,F) and n = 38 (C,D,E) in gSAT. Mitochondrial oxygen flux represents Complex 1 and 2 linked respiratory state (oxidative phosphorylation capacity).
Figure 5
Figure 5
Correlations on change in abdominal subcutaneous adipose tissue (aSAT) mitochondrial oxygen flux, with change in fat mass (kg, A), soleus fat content (B). Change in H2O2 production in aSAT and gluteal SAT (gSAT) with change in gynoid fat mass (%FM) (C,D). Change in H2O2 production in gSAT with change in abdominal SAT volume (E). Data normally distributed and transformed (A,B) prior to Pearson correlations. Not normally distributed data are reported as Spearman’s correlations (C,D,E). All data is pooled, as no group interactions were evident. Sample numbers include, n = 29 (A,D,E), n = 26 (B) and n = 28 (C). Mitochondrial oxygen flux and H2O2 production represents complex 1 and 2 linked respiratory state (oxidative phosphorylation capacity).

References

    1. Evans J, et al. Depot-and ethnic-specific differences in the relationship between adipose tissue inflammation and insulin sensitivity. Clin. Endocrinol. (Oxf.) 2011;74:51–59. doi: 10.1111/j.1365-2265.2010.03883.x. - DOI - PubMed
    1. Kraunsøe R, et al. Mitochondrial respiration in subcutaneous and visceral adipose tissue from patients with morbid obesity. The Journal of Physiology. 2010;588:2023–2032. doi: 10.1113/jphysiol.2009.184754. - DOI - PMC - PubMed
    1. Tran TT, Yamamoto Y, Gesta S, Kahn CR. Beneficial effects of subcutaneous fat transplantation on metabolism. Cell Metabolism. 2008;7:410–420. doi: 10.1016/j.cmet.2008.04.004. - DOI - PMC - PubMed
    1. Carey VJ, et al. Body fat distribution and risk of non-insulin-dependent diabetes mellitus in women: the Nurses’ Health Study. Am. J. Epidemiol. 1997;145:614–619. doi: 10.1093/oxfordjournals.aje.a009158. - DOI - PubMed
    1. Medina-Gómez G. Mitochondria and endocrine function of adipose tissue. Best Practice & Research Clinical Endocrinology & Metabolism. 2012;26:791–804. doi: 10.1016/j.beem.2012.06.002. - DOI - PubMed

Publication types

Substances