. 2020 Mar 2;10(1):3842.
doi: 10.1038/s41598-020-60672-5.

Patient-derived small intestinal myofibroblasts direct perfused, physiologically responsive capillary development in a microfluidic Gut-on-a-Chip Model

Affiliations

Patient-derived small intestinal myofibroblasts direct perfused, physiologically responsive capillary development in a microfluidic Gut-on-a-Chip Model

Kristen M Seiler et al. Sci Rep. .

Abstract

The development and physiologic role of small intestine (SI) vasculature is poorly studied. This is partly due to a lack of targetable, organ-specific markers for in vivo studies of two critical tissue components: endothelium and stroma. This challenge is exacerbated by limitations of traditional cell culture techniques, which fail to recapitulate mechanobiologic stimuli known to affect vessel development. Here, we construct and characterize a 3D in vitro microfluidic model that supports the growth of patient-derived intestinal subepithelial myofibroblasts (ISEMFs) and endothelial cells (ECs) into perfused capillary networks. We report how ISEMF and EC-derived vasculature responds to physiologic parameters such as oxygen tension, cell density, growth factors, and pharmacotherapy with an antineoplastic agent (Erlotinib). Finally, we demonstrate effects of ISEMF and EC co-culture on patient-derived human intestinal epithelial cells (HIECs), and incorporate perfused vasculature into a gut-on-a-chip (GOC) model that includes HIECs. Overall, we demonstrate that ISEMFs possess angiogenic properties as evidenced by their ability to reliably, reproducibly, and quantifiably facilitate development of perfused vasculature in a microfluidic system. We furthermore demonstrate the feasibility of including perfused vasculature, including ISEMFs, as critical components of a novel, patient-derived, GOC system with translational relevance as a platform for precision and personalized medicine research.


Conflict of interest statement

The authors declare no competing interests.

Figures
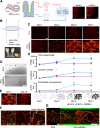
Figure 1
Figure 1
Co-culture of patient-derived ISEMFs and ECs in microfluidic devices to generate perfused vasculature. (A) Schematic representation of SI mucosa, showing its capillary network, to be modeled ex vivo using ECs and ISEMFs. Representative images of fluorescent ECs cultured in the presence (right) or absence (left) of ISEMFs after 24 h are shown. Magnification: 10×, scale bar: 100 μm. (B) Schematic representation of microfluidic device, with actual device beside a penny for size comparison. The central culture chamber abuts media lines, synapsing with them via pores, resulting in a net flow of media and interstitial pressure across the chamber. (C) Effect of EC monoculture (above) vs. co-culture with ISEMFs (below) on vessel development over 7 days (n = 2 per condition). Magnification: 10×, scale bar: 100 μm. (D) Images of standard well-plate culture (as in 1A) of ECs cultured beside fibrin (above), vs ECs cultured beside fibrin-suspended ISEMFs (below), after 7 days in culture. Arrow highlights stability of adjacent fibrin in the absence of ISEMFs vs digestion and collapse of the culture system in the presence of ISEMFs. Magnification 4×, scale bar: 500 μm. This is compared to microfluidic culture (E), where vessel involution in not seen until day 10. Magnification 10×, scale bar: 100 μm. (F) Immunofluorescence co-localization of EC marker CD31 with proliferation marker KI-67 (left), and cell death marker CC3 (middle/right), on day 3 of culture. CC3 expression was only appreciable after media withdrawal (right). Magnification: 10×, scale bar: 100 μm. (G) Microfluidic culture of ECs alone (left, magnification 10×, scale bar: 100 μm), as compared to ECs + ISEMFs (right, magnification 4×, scale bar: 500 μm). 10 μm fluorescent beads (green) flowed through capillaries, which synapsed with microfluidic lines at the pores, in the EC + ISEMF condition only. (H) Quantification of angiogenesis in the presence (blue) or absence (purple) of ISEMFs, as in 1C. Measurements (from top to bottom) included total vessel length, junction number per hpf, and EC expansion (percent fluorescent ECs per hpf, on binary image analysis). Representative binary images are shown below graphs, with ECs (left) and ECs+ ISEMFs (right) at each time point. Graphs are mean +/− SD. *P < 0.05, **P < 0.01.
Figure 2
Figure 2
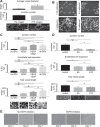
Assessing the identity of ISEMFs and ECs in response to one another. (A) Relative expression of stromal lineage markers VIM, DES, and ACTA2 in ISEMFs grown in the presence of native media (ISEMF media, n = 6) vs. angiogenic media (EGM-2 media, n = 9), and also in the presence of EGM-2 media with co-cultured ECs in a Transwell system (n = 9). Co-cultures were performed overnight. (B) Immunofluorescence staining images of CD31 (ECs) and ACTA2 (ISEMFs), demonstrating their structural relationship (taken on day 5 of culture). Magnification: 10×, scale bar: 100 μm. (C) Immunofluorescence co-localization staining images of EC markers CD31 and UEA-1 (taken on day 3 of culture). Magnification: 10×, scale bar: 100 μm. (D) Relative expression of EC markers CDH5, VWF, and KDR in ECs in mono-culture (n = 8) vs co-culture with ISEMFs in a Transwell system (n = 8). Co-cultures were performed overnight. **P < 0.01, ***P < 0.001, ****P < 0.0001, ns = not significant.
Figure 3
Figure 3
Measuring the responsiveness of ISEMF and EC-derived vasculature to physiologic stimuli. (A) Beginning at time of device loading, microfluidic devices were cultured in either 5% (left) or 21% (right) oxygen (n = 3 per condition). Measured endpoints were vessel diameters (above) and number of junctions (a measure of vessel branching/network complexity) per high powered field (hpf, below). Representative images of vessels at 5% and 21% oxygen are shown. Magnification: 4×, scale bar: 500 μm. (B) Representative images of vessels using loading cell densities of 1.25, 2.5, 5, and 10 million ECs per ml of fibrin, with a 1:3 ratio of ISEMFs to ECs, after 7 days in culture. Magnification: 10×, scale bar: 100 μm (C). Beginning at the time of device loading, cells were cultured in the following conditions (from left to right): no growth factors (n = 2), VEGF only added (n = 3), VEGF and EGF added (n = 3), and all growth factors from EGM-2 media (n = 3). Measured endpoints were (from top to bottom): junction number per hpf, endothelial cell expansion (as determined on binary image analysis), and total vessel length (i.e. the sum of all vessel lengths per hpf). Representative images of vessels cultured under each of these conditions are shown. Magnification: 10×, scale bar: 100 μm. (D) Beginning at the time of device loading, cells were cultured with vehicle control (EGM-2 media +DMSO), or in the presence of EGFR inhibitor Erlotinib at a concentration of 5 or 10 μM (n = 3 for each condition). Measured endpoints from top to bottom: junction number per hpf, endothelial cell expansion (as determined on binary image analysis), and total vessel length per hpf. Representative images of vessels cultured under each of these conditions are shown. Magnification: 4×, scale bar: 500 μm. (E) The effect of EGFR inhibition on established vessel networks was tested by adding Erlotinib (10 μM) after 3 days of standard culture (right), vs continuing standard culture conditions (left). Representative bright field images are shown. Magnification: 10×, scale bar: 100 μm. All graphs are presented as mean +/− SD. *P < 0.05, **P < 0.01, ***P < 0.001, ****P < 0.0001, ns = not significant.
Figure 4
Figure 4
Effects of ECs and ISEMFs on the expansion and TEER of patient-derived HIECs, and integration of perfused vasculature into a patient-derived GOC model that includes HIECs. (A) Measurement of HIEC expansion (as determined on binary image analysis of DAPI staining) when grown on Transwell inserts above conditions as shown (n = 3 for HIEC mono-culture, n = 5 for all other conditions). Representative images of DAPI stained HIECs are shown. Magnification: 40×, scale bar: 50 μm. (B) Measurement of HIEC TEER, assessed daily over the course of 6 days, when grown on Transwell inserts above conditions as shown (n = 3 for HIEC mono-culture, n = 5 for all other conditions). Statistical differences between conditions on days 4 and 6 of culture are presented in the panels to the right. (C) Illustration of combined vasculature and epithelium GOC model. Tissues are cultured in a channel-over-channel design, separated by a thin microporous membrane, with perfused vasculature in the lower channel, and ileal HIECs as a monolayer (atop the membrane) in the upper channel. The lower channel is perfused by adjacent microfluidic media lines, allowing isolation of luminal flow (upper chamber) and systemic circulation (perfused vasculature). (D) Confocal Z-stack image shows epithelium above vasculature. Ileal epithelium has apical secretion of mucin (MUC2, red), and DAPI nuclear counterstain (blue) indicates basolateral nuclear localization, indicative of epithelial polarity when cultured as a monolayer in the upper chamber, with vasculature (indicated by CD31, green) in the lower chamber. Arrow indicates vessel lumen. (E) Top down view of GOC, with staining as in 4D. Magnification: 20×, scale bar: 100 μm. All graphs are presented as mean +/− SD. *P < 0.05, **P < 0.01, ****P < 0.0001, ns = not significant.

Similar articles

Cited by

References

    1. McMellen ME, Wakeman D, Erwin CR, Guo J, Warner BW. Epidermal growth factor receptor signaling modulates chemokine (CXC) ligand 5 expression and is associated with villus angiogenesis after small bowel resection. Surg. 2010;148:364–370. doi: 10.1016/j.surg.2010.03.020. - DOI - PMC - PubMed
    1. Binion DG, et al. Enhanced leukocyte binding by intestinal microvascular endothelial cells in inflammatory bowel disease. Gastroenterology. 1997;112:1895–1907. doi: 10.1053/gast.1997.v112.pm9178682. - DOI - PubMed
    1. Schirbel A, et al. Pro-angiogenic activity of TLRs and NLRs: a novel link between gut microbiota and intestinal angiogenesis. Gastroenterology. 2013;144:613–623 e619. doi: 10.1053/j.gastro.2012.11.005. - DOI - PMC - PubMed
    1. Nandikolla AG, Rajdev L. Targeting angiogenesis in gastrointestinal tumors: current challenges. Transl. Gastroenterol. Hepatol. 2016;1:67. doi: 10.21037/tgh.2016.08.04. - DOI - PMC - PubMed
    1. Schlieve CR, et al. Vascular Endothelial Growth Factor (VEGF) Bioavailability Regulates Angiogenesis and Intestinal Stem and Progenitor Cell Proliferation during Postnatal Small Intestinal Development. PLoS One. 2016;11:e0151396. doi: 10.1371/journal.pone.0151396. - DOI - PMC - PubMed

Publication types