

A multilayer temporal network model for STD spreading accounting for permanent and casual partners
- PMID: 32123251
- PMCID: PMC7052224
- DOI: 10.1038/s41598-020-60790-0
A multilayer temporal network model for STD spreading accounting for permanent and casual partners
Abstract
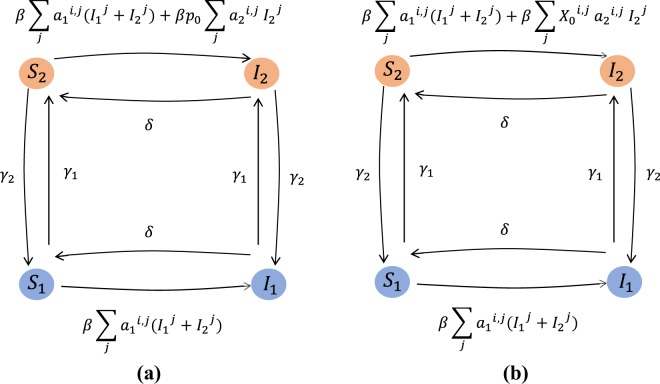
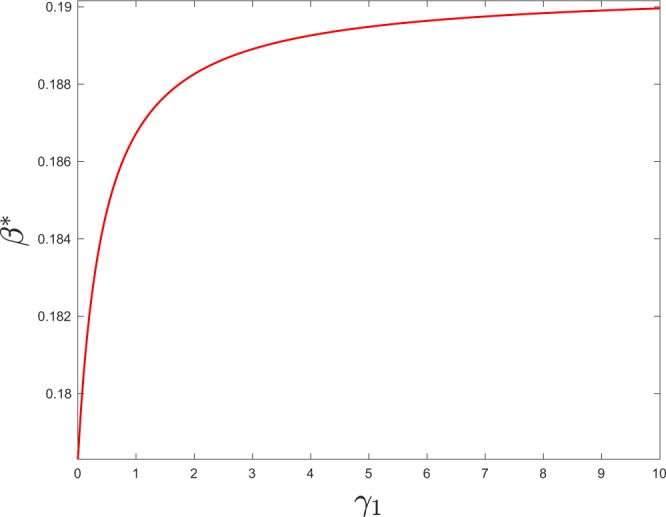
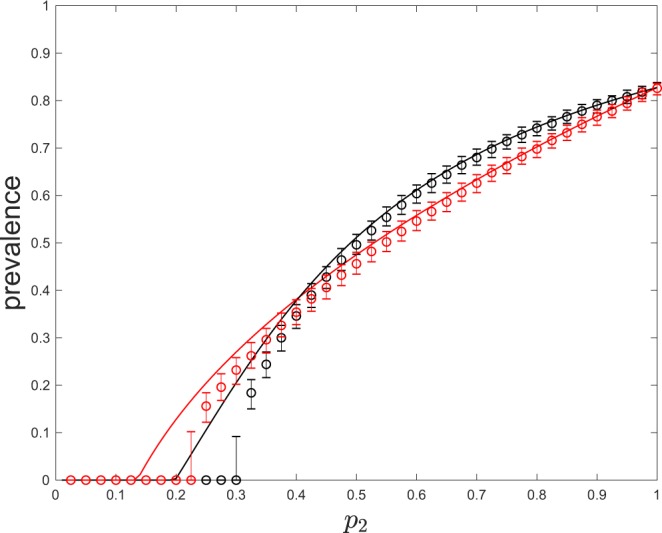
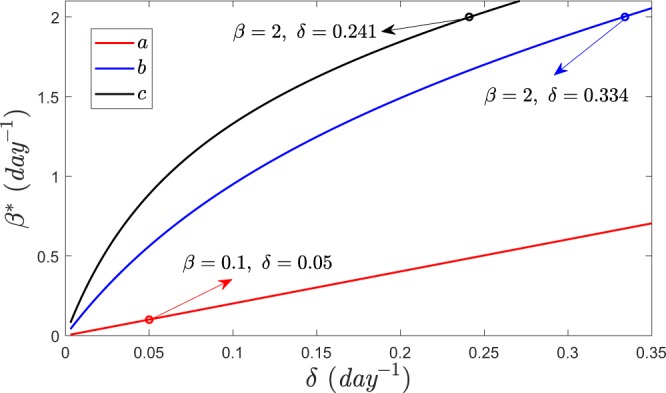
Sexually transmitted diseases (STD) modeling has used contact networks to study the spreading of pathogens. Recent findings have stressed the increasing role of casual partners, often enabled by online dating applications. We study the Susceptible-Infected-Susceptible (SIS) epidemic model -appropriate for STDs- over a two-layer network aimed to account for the effect of casual partners in the spreading of STDs. In this novel model, individuals have a set of steady partnerships (links in layer 1). At certain rates, every individual can switch between active and inactive states and, while active, it establishes casual partnerships with some probability with active neighbors in layer 2 (whose links can be thought as potential casual partnerships). Individuals that are not engaged in casual partnerships are classified as inactive, and the transitions between active and inactive states are independent of their infectious state. We use mean-field equations as well as stochastic simulations to derive the epidemic threshold, which decreases substantially with the addition of the second layer. Interestingly, for a given expected number of casual partnerships, which depends on the probabilities of being active, this threshold turns out to depend on the duration of casual partnerships: the longer they are, the lower the threshold.
Conflict of interest statement
The authors declare that they have no competing interests.
Figures


Similar articles
-
Multiple partners and partner choice as risk factors for sexually transmitted disease among female college students.Sex Transm Dis. 1992 Sep-Oct;19(5):272-8. doi: 10.1097/00007435-199209000-00006. Sex Transm Dis. 1992. PMID: 1411843
-
Estimating the effective rate of sex partner change from individuals with sexually transmitted diseases.Sex Transm Dis. 1994 Jul-Aug;21(4):226-30. doi: 10.1097/00007435-199407000-00009. Sex Transm Dis. 1994. PMID: 7974075
-
A versatile ODE approximation to a network model for the spread of sexually transmitted diseases.J Math Biol. 2002 Nov;45(5):375-95. doi: 10.1007/s002850200153. J Math Biol. 2002. PMID: 12424529
-
An epidemiological approach to sexually transmitted diseases--with special reference to contact tracing and screening.Acta Derm Venereol Suppl (Stockh). 1991;157:1-45. Acta Derm Venereol Suppl (Stockh). 1991. PMID: 1927207 Review.
-
Partnership dynamics in mathematical models and implications for representation of sexually transmitted infections: a review.Ann Epidemiol. 2021 Jul;59:72-80. doi: 10.1016/j.annepidem.2021.04.012. Epub 2021 Apr 28. Ann Epidemiol. 2021. PMID: 33930528 Free PMC article. Review.
Cited by
-
Staged HIV transmission and treatment in a dynamic model with long-term partnerships.J Math Biol. 2023 Apr 13;86(5):74. doi: 10.1007/s00285-023-01885-w. J Math Biol. 2023. PMID: 37052718 Free PMC article.
-
Approximate inference for longitudinal mechanistic HIV contact network.Appl Netw Sci. 2024;9(1):12. doi: 10.1007/s41109-024-00616-4. Epub 2024 Apr 30. Appl Netw Sci. 2024. PMID: 38699247 Free PMC article.
References
-
- Anderson, R. M. & May, R. M. Infectious diseases of humans: dynamics and control (Oxford University Press, 1991).
Publication types
MeSH terms
LinkOut - more resources
Full Text Sources
Medical
Research Materials
