. 2020 Apr;23(4):520-532.
doi: 10.1038/s41593-020-0598-6. Epub 2020 Mar 2.

Dysfunction of cortical GABAergic neurons leads to sensory hyper-reactivity in a Shank3 mouse model of ASD

Affiliations

Dysfunction of cortical GABAergic neurons leads to sensory hyper-reactivity in a Shank3 mouse model of ASD

Qian Chen et al. Nat Neurosci. 2020 Apr.

Abstract

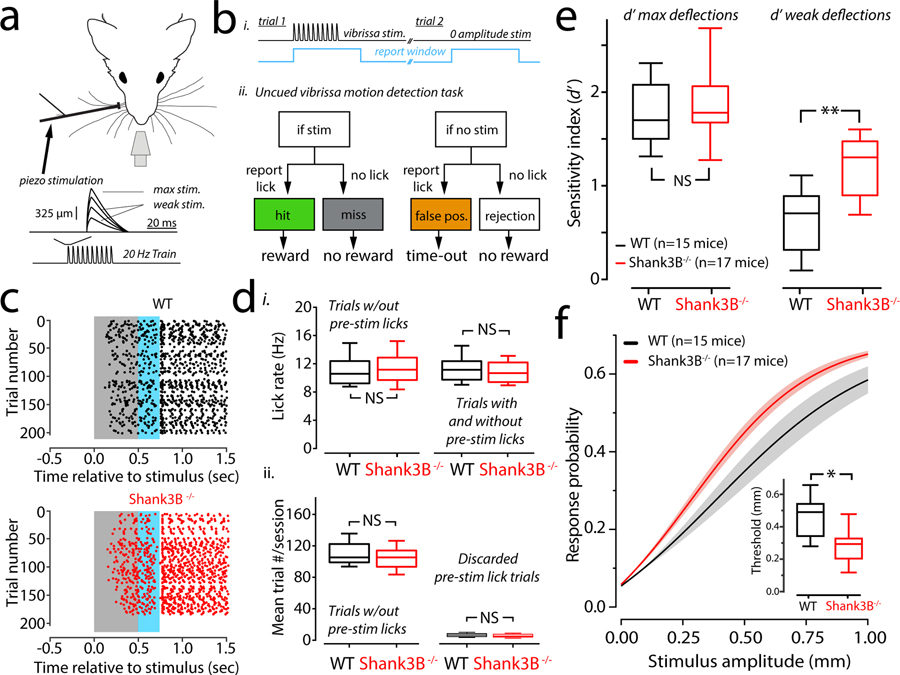
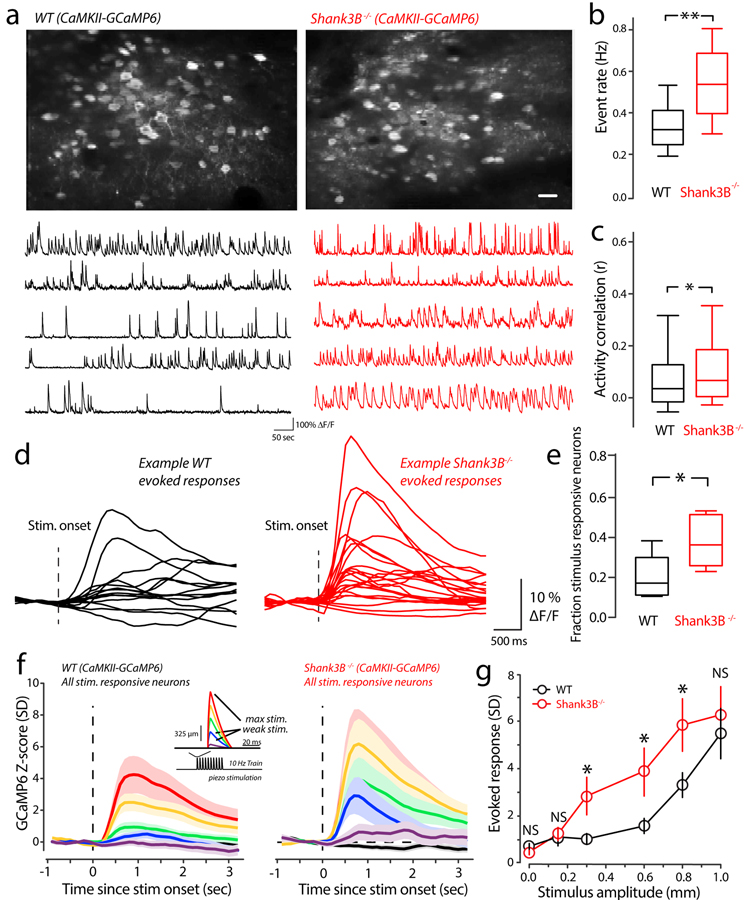
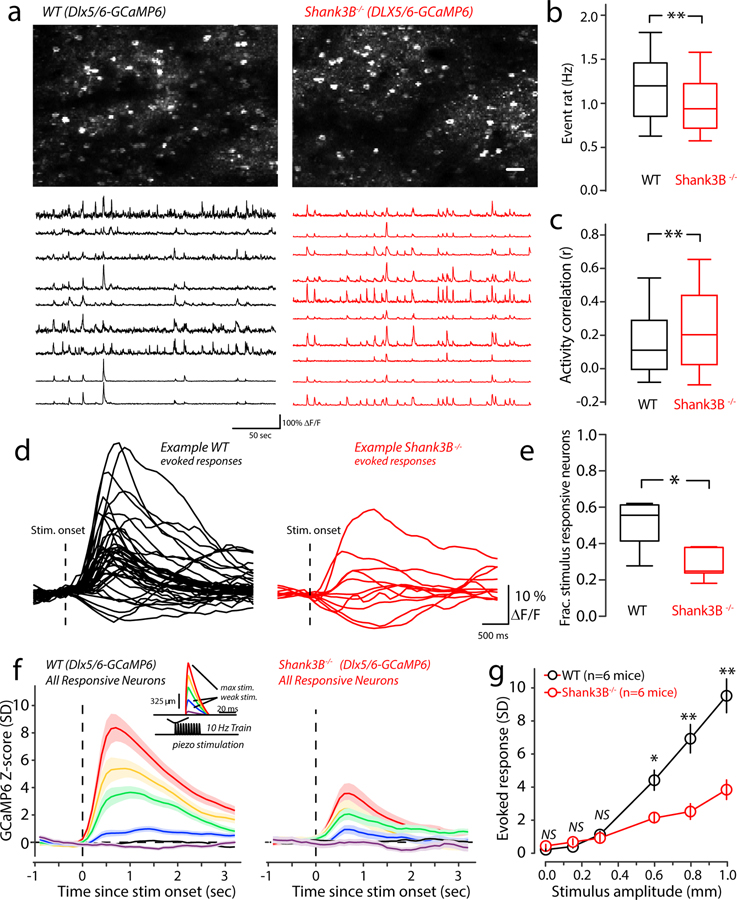
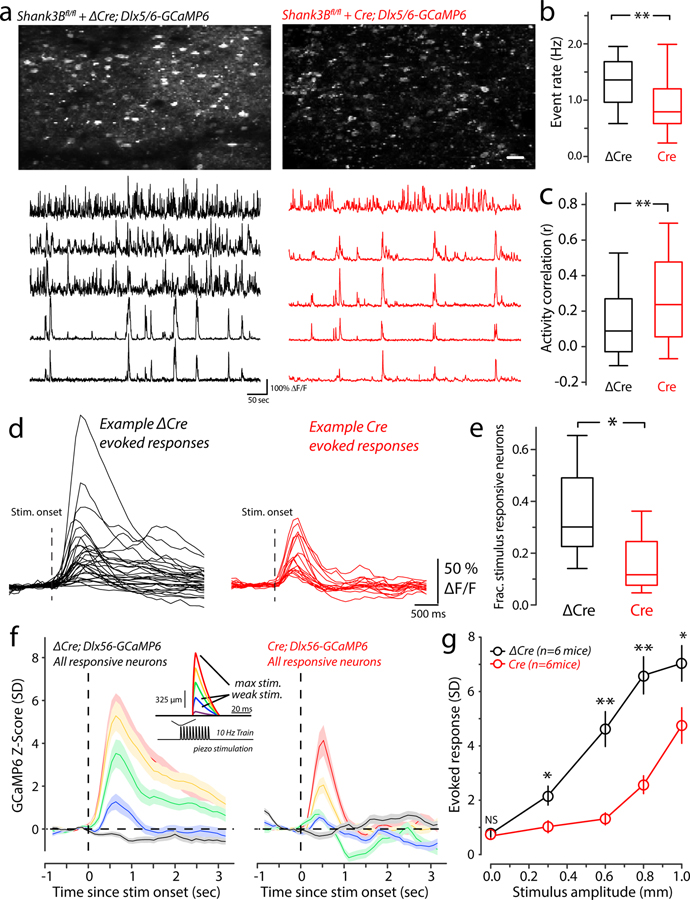
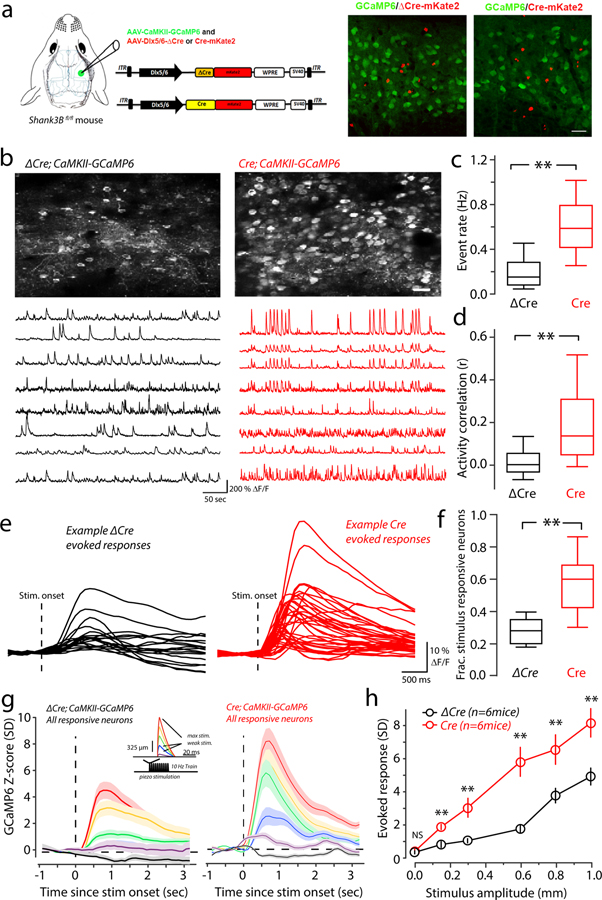
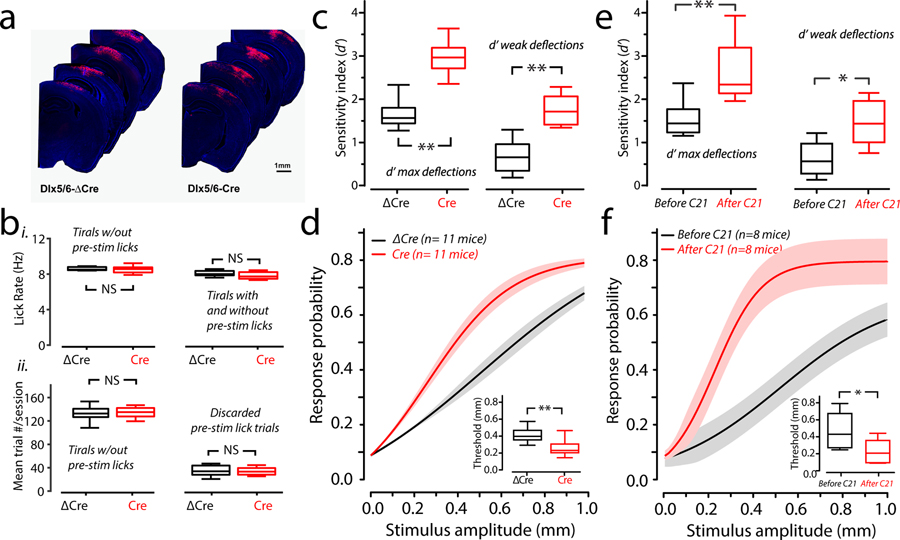
Hyper-reactivity to sensory input is a common and debilitating symptom in individuals with autism spectrum disorders (ASD), but the neural basis underlying sensory abnormality is not completely understood. Here we examined the neural representations of sensory perception in the neocortex of a Shank3B-/- mouse model of ASD. Male and female Shank3B-/- mice were more sensitive to relatively weak tactile stimulation in a vibrissa motion detection task. In vivo population calcium imaging in vibrissa primary somatosensory cortex (vS1) revealed increased spontaneous and stimulus-evoked firing in pyramidal neurons but reduced activity in interneurons. Preferential deletion of Shank3 in vS1 inhibitory interneurons led to pyramidal neuron hyperactivity and increased stimulus sensitivity in the vibrissa motion detection task. These findings provide evidence that cortical GABAergic interneuron dysfunction plays a key role in sensory hyper-reactivity in a Shank3 mouse model of ASD and identify a potential cellular target for exploring therapeutic interventions.


Conflict of interest statement

Competing financial interests

The authors declare no competing financial interests.

Figures

Figure 1.
Figure 1.. Vibrissa detection and stimulus hyper-reactivity in Shank3B−/−mice.
(a) Head-restrained mice were trained to lick at a waterspout when they detected vibrissa motion delivered via a piezo. The blow-up shows the shape of an individual deflection, which had a variable amplitude from trial-to-trial. (b) i) Trials in the task consisted of a variable inter-trial interval (1–6.5 seconds) after which a stimulus was presented (black trace), which coincided with the triggering of a ‘report window’ (blue). ii) Flow chart of the task. (c) Example lick of a WT (top, black dots) and Shank3B−/− (bottom, red dots) in the late stage of training. Each dot represents a lick. These lick rasters show the distribution of individual licks as dots in a given trial relative to stimulus onset. (d) i, Box-plots of mean lick rates for WT (black; n=10 mice) and Shank3B−/− (red; n=10 mice) animals. Left, shows average lick rate for trials analyzed further in the study that showed no pre-stimulus licking. Right, average lick rate but including all the trials discarded due to pre-stimulus licking. In either case, there was no significant difference in lick rates (p=0.7& p=0.8; bootstrap mean-difference test). ii, Left, Box-plots showing the average number of trials per session completed by WT (black) and Shank3B−/− (red) mice. Right, same as left, but the average number of trials that were discarded per session because of pre-stimulus licking. There was no significant difference between WT and Shank3B−/− groups for either comparison (p=0.8, left & p=0.6, right; bootstrap mean-difference test). (e) Box-plots showing the sample distributions of the detection sensitivity (d’) for strong (left) and weak (right) stimuli. Left, there was no statistical difference in the d’ for strong (1 mm) whisker deflections (WT mean ± s.e.m.: 1.79 ± 0.10; black; Shank3B−/− mean ± s.e.m.: 1.8 ±0.11, red; n=15 WT, n=17 Shank3B−/−; p=0.53; bootstrap mean-difference test). Right, Shank3B−/− mice have a significantly higher d’ for weak stimuli (WT mean ± s.e.m.: 0.59 ± 0.10; Shank3B−/− mean ± s.e.m.: 1.2 ± 0.09; n=15 WT, black; n=17 Shank3B−/− mice, red; **p<0.0001; bootstrap mean-difference test). (f) Mean psychometric curves (sigmoidal function fits) from the sessions used in e. Solid lines denote the mean, and the shaded regions are the standard error of the mean. The inset show a significant difference of detection threshold between groups (WT mean ± s.e.m.: 449 ± 42 μm; Shank3B−/− mean ± s.e.m.: 296 ± 43 μm; n=15 WT mice and 17 Shank3B−/− mice; *p=0.003; bootstrap mean-difference test; ). There was also a difference in the unitless slope-factor (WT mean ± s.e.m.: 232 ± 17 μm; Shank3B−/− mean ± s.e.m.: 149 ± 18 μm, n=15 WT mice and 17 Shank3B−/− mice; p<0.0001, bootstrap mean-difference test), which is a fit parameter related to how steep the curve is. Box-and-whisker plots show median values (middle vertical bar) and 25th (bottom side of the box) and 75th percentiles (top side of the box) with whiskers indicating the range. All bootstrap mean-difference tests were two-sided. These results repeated three times.
Figure 2.
Figure 2.. Enhanced spontaneous and stimulus-evoked activity in Shank3B−/− excitatory neurons.
(a) Upper panels: example mean two-photon CaMKII-GCaMP6 imaging fields from a WT (left) and Shank3B−/− (right) mouse. Scale bar is 50 μm. Lower panels: example spontaneous ΔF/F time-series traces from the upper imaging fields from WT (left) and Shank3B−/− (right) mouse. (b) Box-plots quantifying differences of spontaneous calcium event rate that was determined by counting the total number of deconvolved individual Ca2+-events for ten minutes (n=612 neurons from 6 WT mice; 653 neurons from 6 Shank3B−/− mice). Asterisk denotes a statistically significant difference between the sample groups (**p<0.0001; bootstrap mean-difference test). (c) The correlation between spontaneous firing was quantified as the Spearman’s rank correlation coefficient (ρ). Box-plots show the distribution of all pooled correlations between WT and Shank3B−/− excitatory neurons (n=65,931 pairs from 6 WT mice; n=65,092 pairs from 6 Shank3B−/− mice), and show an overall increase in correlations among excitatory neurons in Shank3B−/− compared to WT. Asterisk denotes a statistically-significant difference between the sample groups (*p=0.004; bootstrap mean-difference test). (d) Example traces showing the ΔF/F responses to maximal (1mm) whisker deflections stimulus of the responsive neurons from a representative WT (black) and Shank3B−/− (red) mice. The dashed line indicates the onset of the whisker stimulus. (e) Box-plots showing the fraction of neurons determined to be stimulus responsive in WT (black; n=6) and Shank3B−/− (red; n=6) mice. Asterisk denotes a statistically significant difference between the sample groups (*p=0.002; bootstrap mean-difference test). (f) Left panel: The magnitude of evoked responses in WT mice, across the range of stimulus amplitudes. We quantified this by constructing peri-stimulus time histograms (PSTHs) from Z-scored evoked-responses for all of the responsive neurons (n=107 from 6 WT mice, n=93 from 6 Shank3B−/− mice). The average response for each stimulus amplitude is color coded as indicated by the inset showing the piezo-stimulus waveform (red is the maximal deflection; purple is the weakest). Line on all plots indicate the mean and the shaded regions corresponds to the standard error of the mean. Right panel: same as in left panel, but from Shank3B−/− mice. (g) Comparison of peak-evoked responses across the stimulus-amplitudes tested for responsive neurons (n=107 from 6 WT mice (black), n=93 from 6 Shank3B−/− mice (red). The center of the circles represents the mean and the error bars represent to the standard error of the mean. Asterisks denote statistically significant differences (n=107 from 6 WT mice; n=93 from 6 Shank3B−/− mice, *p<0.05, NS denotes no difference p>0.05; bootstrap mean-difference test), p-values in order from left-to-right: 0.24, 0.75, 0.03, 0.03, 0.04, 0.75). These results repeated three times. Box-and-whisker plots show median values (middle vertical bar) and 25th (bottom side of the box) and 75th percentiles (top side of the box) with whiskers indicating the range. All bootstrap mean-difference tests were two-sided.
Figure 3.
Figure 3.. Reduced spontaneous and stimulus-evoked activity in Shank3B−/− inhibitory neurons.
(a) Upper panels: example mean two-photon Dlx5/6-GCaMP6 imaging fields from a WT (left) and Shank3B−/− (right) mouse. Scale bar is 50 μm. Lower panels: example spontaneous ΔF/F time-series traces from the upper imaging fields from WT (left) and Shank3B−/− (right) mouse. (b) Box-plots quantifying differences of spontaneous calcium event rate that was determined by counting the total number of deconvolved individual Ca2+-events for ten minutes (n=382 neurons from 6 WT mice; 402 neurons from 6 Shank3B−/− mice). Asterisk denotes a statistically significant difference between the sample groups (**p<0.0001; bootstrap-mean-difference test). (c) The correlation between spontaneous firing was quantified as the Spearman’s rank correlation coefficient (ρ) for all possible pairings in each imaging session, and then pooled across sessions. Box-plots show the distribution of all pooled correlations between WT and Shank3B−/− inhibitory neurons (n=39,018 pairs from 6 WT mice; 43,954 pairs from 6 Shank3B−/− mice), and show an overall increase in correlations among inhibitory neurons in Shank3B−/− compared to WT. Asterisk denotes a statistically significant difference between the sample groups (**p<0.0001; bootstrap mean-difference test). (d) Example traces showing the ΔF/F responses to maximal (1mm) whisker deflections stimulus of the responsive neurons from a representative WT (black) and Shank3B−/− (red) mice. The dashed line indicates the onset of the whisker stimulus. (e) Box-plots showing the fraction of neurons determined to be stimulus responsive in WT (black; n=6) and Shank3B−/− (red; n=6) mice. Asterisk denotes a statistically significant difference between the sample groups (; mean proportion WT =0.58 ± 0.05, n= 6 mice; mean proportion Shank3B−/− = 0.28 ± 0.06, n= 6 mice; *p=0.0002; bootstrap mean-difference test). (f) Left panel: The magnitude of evoked responses in WT mice, across the range of stimulus amplitudes. We quantified this by constructing peri-stimulus time histograms (PSTHs) from Z-scored evoked-responses for all of the responsive neurons (n=237 from 6 WT mice, n=114 from 6 Shank3B−/− mice). The average response for each stimulus amplitude is color coded as indicated by the inset showing the piezo-stimulus waveform (red is the maximal deflection; purple is the weakest). Line indicates the mean and the shaded region corresponds to the standard error of the mean. Right panel: same as in left panel, but from Shank3B−/− mice. (g) Comparison of peak-evoked responses across the stimulus-amplitudes tested for WT (black) and Shank3B−/− (red) mice, (n=237 from 6 WT mice, n=114 from 6 Shank3B−/− mice). Center of circles represent the mean and the error bars indicate the standard error of the mean, asterisks denote statistically significant differences (NS denotes no difference p>0.05; *p<0.05, **p<0.0001, bootstrap mean-difference test, p-values in order from left-to-right: 0.5, 0.6, 0.9, 0.001, <0.0001, <0.0001. These results repeated three times. Box-and-whisker plots show median values (middle vertical bar) and 25th (bottom side of the box) and 75th percentiles (top side of the box) with whiskers indicating the range. All bootstrap mean-difference tests were two-sided.
Figure 4.
Figure 4.. Reduced spontaneous and stimulus-evoked activity in inhibitory neurons after preferential deletion of Shank3 in interneurons in vS1.
(a) Upper panels: example mean two-photon Dlx5/6-GCaMP6 imaging fields from an AAV-Dlx5/6-ΔCre-mKate2-injected (left) and AAV-Dlx5/6-Cre-mKate2-injected (right) Shank3Bfl/fl mouse. Scale bar is 50 μm. Lower panels: example spontaneous ΔF/F time-series traces from the upper imaging fields from Dlx5/6-ΔCre-injected (left) and Dlx5/6-Cre-injected (right) Shank3Bfl/fl mouse. (b) Box-plots quantifying differences of spontaneous calcium event rate that was determined by counting the total number of deconvolved individual Ca2+-events for ten minutes (n=432 neurons from 6 Dlx5/6-ΔCre-injected mice; 407 neurons from 6 Dlx5/6-Cre-injected mice). Asterisk denotes a statistically significant difference between the sample groups (**p<0.0001; bootstrap mean-difference test). (c) The correlation between spontaneous firing was quantified as the Spearman’s rank correlation coefficient (ρ) for all possible pairings in each imaging session, and then pooled across sessions. Box-plots show the distribution of all pooled correlations between Dlx5/6-ΔCre-injected (control group) and Dlx5/6-Cre-injected (local knock-out group) inhibitory neurons (n=37,464 pairs from 6 Dlx5/6-ΔCre-injected mice; n=35,372 pairs from 6 Dlx5/6-Cre-injected mice), and show an overall increase in correlations among inhibitory neurons in Dlx5/6-Cre-injected compared to Dlx5/6-ΔCre-injected. Asterisk denotes a statistically significant difference between the sample groups (**p<0.0001; bootstrap mean-difference test). (d) Example traces showing the ΔF/F responses to maximal (1mm) whisker deflections stimulus of the responsive neurons from a representative Dlx5/6-ΔCre-injected (black) and Dlx5/6-Cre-injected (red) mice. The dashed line indicates the onset of the whisker stimulus. (e) Box-plots showing the fraction of neurons determined to be stimulus responsive neurons in Dlx5/6-ΔCre-injected (black; n=6) and Dlx5/6-Cre-injected (red; n=6) mice. Asterisk denotes a statistically significant difference between the sample groups (Dlx5/6-ΔCre group proportion = 0.39 ± 0.09, n=6 mice; Dlx5/6-Cre group proportion = 0.16 ± 0.05, n=6 mice; mean ± s.e.m.; *p=0.01; bootstrap mean-difference test). (f) Left panel: The magnitude of evoked responses in Dlx5/6-ΔCre-injected mice, across the range of stimulus amplitudes was quantified by constructing peri-stimulus time histograms (PSTHs) from Z-scored evoked-responses for all of the responsive neurons (n=102 from 6 Dlx5/6-ΔCre mice, n=58 from 6 Dlx5/6-Cre mice). The average response for each stimulus amplitude is color coded as indicated by the inset showing the piezo-stimulus waveform (red is the maximal deflection, purple is the weakest). Line on all plots indicate the mean and the shaded regions corresponds to the standard error of the mean. Right panel: same as in left panel, but from Dlx5/6-ΔCre-injected. (g) Comparison of peak-evoked responses across the stimulus-amplitudes tested for Dlx5/6-ΔCre-injected (black) and Dlx5/6-Cre-injected (red) mice (n=102 from 6 Dlx5/6-ΔCre mice, n=58 from 6 Dlx5/6-Cre mice). Asterisks denote statistically significant differences (*p<0.05, **p<0.0001, NS denotes no p>0.05; bootstrap mean-difference test, p-values in order from left-to-right: 0.4, 0.003, <0.0001, <0.0001 and 0.03). Box-and-whisker plots show median values (middle vertical bar) and 25th (bottom side of the box) and 75th percentiles (top side of the box) with whiskers indicating the range. All bootstrap mean-difference tests were two-sided. ΔCre: AAV-Dlx5/6-ΔCre-mKate2-injected mouse group; Cre: AAV-Dlx5/6-Cre-mKate2-injected mouse group.
Figure 5.
Figure 5.. Preferential deletion of Shank3 in vS1 interneurons also results in enhanced spontaneous and stimulus-evoked activity in excitatory neurons.
(a) Left panel: selective deletion of Shank3 in the interneurons of somatosensory cortex was achieved by injection interneuron-specific AAV-Cre virus (AAV-Dlx5/6-Cre-mKate2 or AAV-Dlx5/6-ΔCre-mKate2 as control) in Shank3Bfl/fl mice. AAV-CaMKII-GCaMP6 (CaMKII-GCaMP6) virus was co-injected to monitor the neuronal activity in pyramidal neurons. Right panel: The confocal image of the GCaMP6(green) and Dlx5/6-ΔCre/Cre expression (red) in an AAV-Dlx5/6-ΔCre-mKate2 -injected (left) and AAV-Dlx5/6-Cre-mKate2-injected Shank3Bfl/fl mouse(right). (b) Upper: example mean two-photon CaMKII-GCaMP6 imaging fields from a Dlx5/6-ΔCre (left) and Dlx5/6-Cre-injected (right) mouse. Scale bar is 50 μm. Lower panels: example spontaneous ΔF/F time-series traces from the upper imaging fields from Dlx5/6-ΔCre-injected (left) and Dlx5/6-Cre-injected (right) mouse. (c) Box-plots quantifying differences of spontaneous calcium event rate that was determined by counting the total number of deconvolved individual Ca2+-events for ten minutes (n=486 neurons from 6 Dlx5/6-ΔCre-injected mice; 510 neurons from 6 Dlx5/6-Cre-injected mice). Asterisk denotes a statistically significant difference between the sample groups (**p<0.0001; bootstrap mean-difference test). (d) The correlation between spontaneous firing was quantified as the Spearman’s rank correlation coefficient (ρ) for all possible pairings in each imaging session, and then pooled across sessions. Box-plots show the distribution of all pooled correlations between Dlx5/6-ΔCre-injected (control group) and Dlx5/6-Cre-injected (local knockout group) excitatory neurons (n=38,874 pairs from 6 Dlx5/6-ΔCre-injected mice; 40,178 pairs from 6 Dlx5/6-Cre-injected mice), and show an overall increase in correlations among excitatory neurons in Dlx5/6-Cre-injected compared to Dlx5/6-ΔCre-injected. Asterisk denotes a statistically significant difference between the sample groups (**p<0.0001; bootstrap mean-difference test). (e) Example traces showing the ΔF/F responses to maximal (1mm) whisker deflections stimulus of the responsive neurons from a representative Dlx5/6-ΔCre-injected (black) and Dlx5/6-Cre-injected(red) mice. The dashed line indicates the onset of the whisker stimulus. (f) Box-plots showing the fraction of neurons determined to be stimulus responsive in Dlx5/6-ΔCre-injected (black; n=6) and Dlx5/6-Cre-injected (red; n=6) mice. Asterisk denotes a statistically significant difference between the sample groups (Dlx5/6-ΔCre proportion = 0.16 ± 0.06, n= 6 mice; Dlx5/6-Cre proportion = 0.35±0.08, n=6 mice; **p<0.0001; bootstrap mean-difference test). (g) Left panel: The magnitude of evoked responses in Dlx5/6-ΔCre-injected mice, across the range of stimulus amplitudes. We quantified this by constructing peri-stimulus time histograms (PSTHs) from Z-scored evoked-responses for all of the responsive neurons (n=123 neurons from 6 Dlx5/6-ΔCre-injected mice and 188 neurons from 6 Dlx5/6-Cre-injected mice). The average response for each stimulus amplitude is color coded as indicated by the inset showing the piezo-stimulus waveform (red is the maximal deflection, purple is the weakest). Solid lines correspond to the mean and the colored shaded regions correspond to the standard error of the mean. Right panel: same as in left panel, but from Dlx5/6-Cre-injected. (h) Comparison of peak-evoked responses across the stimulus-amplitudes tested for all responsive neurons in Dlx5/6-ΔCre-injected (black; n=123 neurons from 6 mice) and Dlx5/6-Cre-injected (red; n=188 neurons from 6 mice) Shank3Bfl/fl mice. The center of the circles represents to the mean and the error bars represent to the standard error of the mean. Asterisks denote statistically significant differences (**p<0.0001, NS denotes no difference p>0.05; bootstrap mean-difference test, p-values in order from left-to-right: 0.5, <0.0001, <0.0001, <0.0001, <0.0001, <0.0001). These results repeated two times. Box-and-whisker plots show median values (middle vertical bar) and 25th (bottom side of the box) and 75th percentiles (top side of the box) with whiskers indicating the range. All bootstrap mean-difference tests were two-sided. ΔCre: AAV-Dlx5/6-ΔCre-mKate2-injected mouse group; Cre: AAV-Dlx5/6-Cre-mKate2-injected mouse group.
Figure 6.
Figure 6.. Preferential deletion of Shank3 in Interneurons of vS1 leads to behavioral hyper-reactivity of the somatosensory system.
(a) Shank3Bfl/fl mice were injected with an AAV containing either a Dlx5/6-ΔCre or Dlx5/6-Cre construct in vS1. The image montage shows the extent of localization of ΔCre or Cre expression in two example mice. (b) i, Box-plots of mean lick rates for Dlx5/6-ΔCre (black) and Cre (red) injected animals. Left, average lick rate for trials that showed no pre-stimulus licking at all. Right, average lick rate including trials on the left and trials that showed pre-stimulus licking. In either case, there was no significant difference in lick rates (p=0.8 left, p=0.5 right; bootstrap mean-difference test). ii, left, Box-plots showing the number of trials per session completed by Dlx5/6-ΔCre (black; n=6 mice) and Dlx5/6-Cre (red; n =6 mice) injected animals. (p=0.7; bootstrap mean-difference test). Right, same as left, but the average number of trials with pre-stimulus licks (which were not analyzed). There was no significant difference (p=0.8; bootstrap mean-difference test). (c) Left, Box and whisker plots showing the bootstrap estimate of population mean d’ for maximal stimuli for Dlx5/6-ΔCre (black; n=11 mice) and Dlx5/6-Cre (red; n=11 mice) injected animals. Right, same but showing d’ for weak stimuli. There was a significant difference in both maximal d’ (Dlx5/6-ΔCre mean ± s.e.m.: 1.59 ± 0.12; Dlx5/6-Cre: 2.92 ± 0.14, **p<0.0001, bootstrap mean-difference test) and weak d’ (Dlx5/6-ΔCre mean ± s.e.m.: 0.65 ± 0.13; Dlx5/6-Cre: 1.73 ± 0.12; n=11 mice for each group; **p<0.0001, bootstrap mean-difference test). (d) Mean psychometric curves (non-normalized sigmoidal function fits) from the same sessions used in c. Solid lines denote the mean, and the shaded regions are the standard error of the mean. The inset show a significant difference of detection threshold between groups (**p<0.0001; bootstrap mean-difference test, Dlx5/6-ΔCre mean ± s.e.m.: 416 ± 31 μm; Dlx5/6-Cre: 266 ± 35 μm; n= 11 mice from each group). There was also a difference in the slope factors (Dlx5/6-ΔCre mean ± s.e.m.: 207 ± 13; Dlx5/6-Cre: 127 ± 17; n=11 mice in each group **p<0.0001, bootstrap mean-difference test). (e) Box and whisker plots showing the bootstrap estimate of population mean d’ maximal stimuli for the hM4Di-injected mice before (black) and after (red) C21 infusion (**p<0.0001, bootstrap mean-difference test; before-C21 mean ± s.e.m.: 1.58 ± 0.17; after-C21: 2.73 ± 0.31). Right, same but showing d’ for weak stimuli (before- C21 mean ± s.e.m.: 0.62 ± 0.16; after-C21: 1.46 ± 0.21; n=8 mice; *p=0.0002, bootstrap mean-difference test). (f) Mean psychometric curves (non-normalized sigmoidal function fits) from the same sessions used in e. Solid lines denote the mean, and the shaded regions are the standard error of the mean. The inset show a significant difference of detection threshold between groups (pre-C21 mean ± s.e.m.: 525 ± 151 μm; post-C21: 233 ± 55 μm; n= 8 mice from each group; *p=0.004; bootstrap mean-difference test). The slope-factor was also significantly different (pre-C21 mean ± s.e.m.: 270 ± 65, post-C21: 114 ± 23; n=8 mice; p=0.02; bootstrap mean-difference test). These results repeated two times. Box-and-whisker plots show median values (middle vertical bar) and 25th (bottom side of the box) and 75th percentiles (top side of the box) with whiskers indicating the range. All bootstrap mean-difference tests were two-sided. ΔCre: AAV-Dlx5/6-ΔCre-mKate2-injected mouse group; Cre: AAV-Dlx5/6-Cre-mKate2-injected mouse group.

References

    1. Amso D, Haas S, Tenenbaum E, Markant J & Sheinkopf SJ. Bottom-up attention orienting in young children with autism. Journal of autism and developmental disorders 44, 664–673, doi:10.1007/s10803-013-1925-5 (2014). - DOI - PMC - PubMed
    1. Leekam SR, Nieto C, Libby SJ, Wing L & Gould J. Describing the sensory abnormalities of children and adults with autism. Journal of autism and developmental disorders 37, 894–910, doi:10.1007/s10803-006-0218-7 (2007). - DOI - PubMed
    1. Wang AT. et al. Neural selectivity for communicative auditory signals in Phelan-McDermid syndrome. Journal of neurodevelopmental disorders 8, 5, doi:10.1186/s11689-016-9138-9 (2016). - DOI - PMC - PubMed
    1. Gogolla N, Takesian AE, Feng G, Fagiolini M & Hensch TK. Sensory integration in mouse insular cortex reflects GABA circuit maturation. Neuron 83, 894–905, doi:10.1016/j.neuron.2014.06.033 (2014). - DOI - PMC - PubMed
    1. Goncalves JT, Anstey JE, Golshani P & Portera-Cailliau C. Circuit level defects in the developing neocortex of Fragile X mice. Nature neuroscience 16, 903–909, doi:10.1038/nn.3415 (2013). - DOI - PMC - PubMed

Methods-only References

    1. Thompson KJ. et al. DREADD Agonist 21 Is an Effective Agonist for Muscarinic-Based DREADDs in Vitro and in Vivo. ACS pharmacology & translational science 1, 61–72, doi:10.1021/acsptsci.8b00012 (2018). - DOI - PMC - PubMed
    1. Chen Q. et al. Imaging neural activity using Thy1-GCaMP transgenic mice. Neuron 76, 297–308, doi:10.1016/j.neuron.2012.07.011 (2012). - DOI - PMC - PubMed
    1. Truszkowski TL. et al. A cellular mechanism for inverse effectiveness in multisensory integration. eLife 6, doi:10.7554/eLife.25392 (2017). - DOI - PMC - PubMed
    1. Guizar-Sicairos M, Thurman ST & Fienup JR. Efficient subpixel image registration algorithms. Optics letters 33, 156–158 (2008). - PubMed
    1. Kerlin AM, Andermann ML, Berezovskii VK & Reid RC. Broadly tuned response properties of diverse inhibitory neuron subtypes in mouse visual cortex. Neuron 67, 858–871, doi:10.1016/j.neuron.2010.08.002 (2010). - DOI - PMC - PubMed

Publication types

MeSH terms