. 2020 Jan 20:6:2.
doi: 10.1038/s41420-020-0237-8. eCollection 2020.

Preclinical studies reveal MLN4924 is a promising new retinoblastoma therapy

Affiliations

Preclinical studies reveal MLN4924 is a promising new retinoblastoma therapy

Arthur Aubry et al. Cell Death Discov. .

Abstract

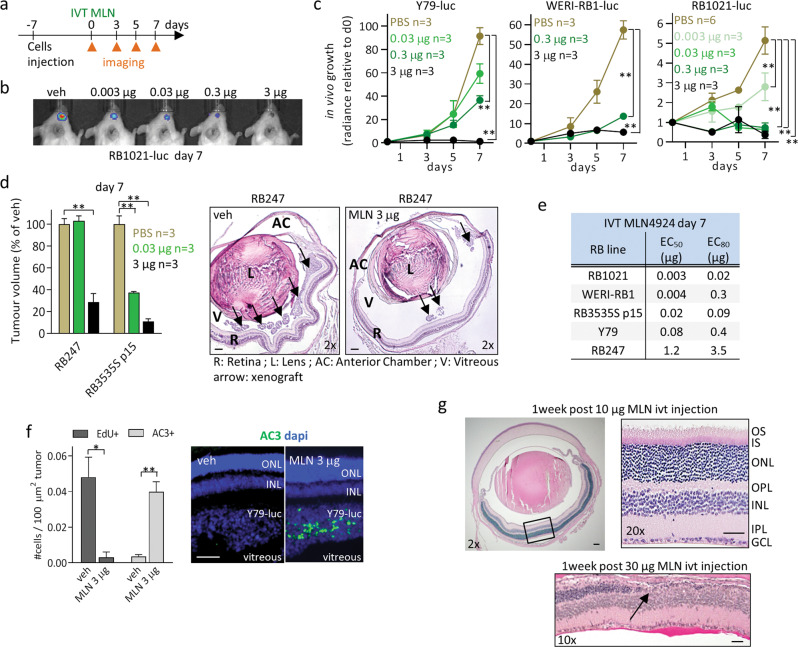
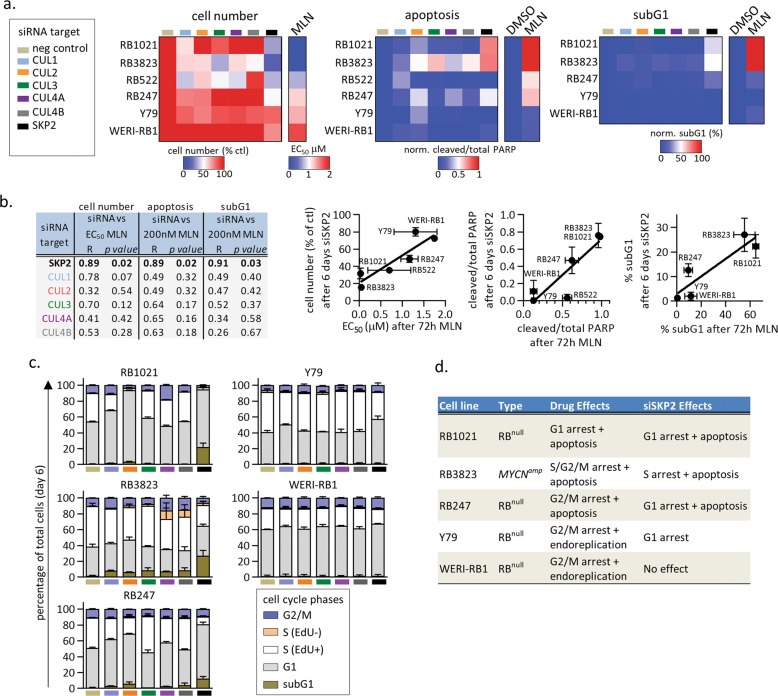
RB1 loss (RB1 null ) or MYCN amplification (MYCN amp ) in fetal human retina causes retinoblastoma. SKP2 loss kills RB1 null cells, but small molecule SKP2 inhibitors remain unexplored therapeutically. Whether SKP2 is synthetic lethal in MYCN amp retinoblastoma is unclear. SKP2 is the substrate recognition component of two Cullin-RING Ligase complexes (CRL1SKP2/SCFSKP2, and CRL4SKP2), a family of multiprotein E3 ubiquitin ligases. NEDD8 activating enzyme (NAE) is required for Cullin neddylation and thus CRL activation. Here, we show that the NAE inhibitor, Pevonedistat (MLN4924), potently inhibits RB1 null and MYCN amp tumors. Intravitreal MLN4924 suppressed multiple human xenografts with EC80s from 20 ng to 3.5 μg. Maximum tolerated dose (MTD) was 10-30 μg, highlighting a favorable therapeutic window. Inhibition of Cullin neddylation was similar in all cases, but cellular effects ranged from G1 arrest with apoptosis to G2/M arrest with endoreplication. However, even in less sensitive lines (EC50 ≈ 1 μM), prolonged exposure was lethal or induced persistent cytostasis. Mechanistically, depleting any single Cullin did not fully recapitulate drug phenotypes, but sensitivity to SKP2 loss correlated with that of drug. Thus, intravitreal MLN4924 is a promising new retinoblastoma therapy, mimicking the cancer-specific lethality of eliminating SKP2 complexes.

Keywords: Eye cancer; Targeted therapies.


Conflict of interest statement

Conflict of interestThe authors declare that they have no conflict of interest.

Figures

Fig. 1
Fig. 1. IVT MLN4924 impedes RB growth in vivo.
a Experimental design for assessing the efficacy of IVT MLN4924 in orthotopic RB xenografts. b Representative image of the radiance total flux signal (photons/second) of RB1021-luc tumors treated with the indicated doses of IVT MLN4924 at day 7. c In vivo growth curves of Y79-luc, WERI-RB1-luc, and RB1021-luc tumors treated with the indicated doses of IVT MLN4924. Radiance total flux (photons/second) values were acquired at day 0, 3, 5, 7 and normalized to d0 for each tumor, then plotted as mean +/− SD (**P < 0.01 by Student t-test). n represents the number of mice; tumors were established in the right eye of each animal. d On the left—Normalized tumor volumes at day 7 of unlabeled RB247 and RB3535S (p15) treated with the indicated doses of IVT MLN4924; volumes were quantified by planimetric method, averaged, and plotted as percentage +/− SD of PBS vehicle (**P < 0.01 by Student t-test); On the right—representative H&E-stained eye section with RB247 tumors and treated as indicated at day 7. Scale bar is 100 μm. e Summary of the in vivo EC50s and EC80s of IVT MLN4924 in orthotopic RB xenografts. f On the left—quantification of replicating (EdU+) and apoptotic (AC3+) cells in Y79-luc tumors treated as indicated at day 7. Plot shows mean +/− SD (n = 3 *P < 0.05, **P < 0.01 by Student t-test); On the right—representative AC3 immunofluorescence staining with DAPI of Y79-luc tumors treated as indicated at day 7. Scale bar is 100 μm. g Representative eye sections treated as indicated and stained with H&E at day 7. The black arrow pinpoints area of photoreceptor layer disappearance. Scale bars are 100 μm.
Fig. 2
Fig. 2. Cellular and molecular effects of MLN4924 on RB cell lines.
a Representative bright field image of the indicated human RB1null and MYCNamp RB cell lines in culture used in this study. Scale bar is 50 μm. b Expression profiles of pRB and MYCN were confirmed by Western blot in RB1null and MYCNamp RB cell lines. The non-small cell lung cancer A549 and breast MDA-MB-231 cell lines were used as positive control for pRB expression. c RB cells (color coded as indicated in the table) were treated with different concentrations of MLN4924 (0, 0.008, 0.04, 0.2, 1, 5, 25, 125 µM) for 72 h, then cell number was quantified using the CellTiterGlo luminescent assay and the data was normalized as percentage of control. The average of two independent experiments is plotted. Error bars indicate the range. In vitro EC50s of MLN4924 and their respective range in RB lines were computed using Graphpad Prism software and summarized. d, e The indicated RB cell lines were treated with DMSO, 0.2, 1, 5, and 25 μM MLN4924 for 72 h, then protein lysates were prepared to assess levels of Cullin neddylation (NEDD8-Cullin) and apoptosis (PARP cleavage) by Western blot in d. In parallel, live cells were counted using trypan blue exclusion. PARP cleavage and cell number data were then normalized to DMSO control in each line. The averages of two biological replicates are shown as heatmaps in e. f, g RB1021 and WERI-RB1 cells were treated with 1 µM MLN4924, and at different timepoints (3, 6, 12, 24, 48 h) the drug was washed-off and replaced by fresh drug-free medium as indicated. At 72 h, floating and adherent live cells were counted and normalized as percentage of control (Supplementary Fig. 2 shows images of the adhesion phenotype). The average of two biological replicates is plotted in f. Error bars indicate the range. In parallel, protein lysates were prepared to assess PARP cleavage by Western blot. Quantification (n = 2 average +/− range) and a representative blot are shown in g. h Two hypersensitive (RB1021 and RB3823) and two sensitive (WERI-RB1 and Y79) RB lines were treated with 1 µM MLN4924, and at the indicated timepoints (3, 6, 12, 24, 48, 72 h) protein lysates were prepared to assess levels of Cullin neddylation (NEDD8-Cullin) and apoptosis (PARP cleavage) by Western blot. i, j Less sensitive WERI-RB1 and Y79 cells were treated with 0.2 and 1 µM MLN4924 for 9 days. Cell number was quantified as previously at d3, d6, d9, and normalized to d0. In parallel, apoptosis was quantified by PARP cleavage. Cell growth and apoptosis data are graphed in i and j, respectively (n = 3 mean +/− SD ***P < 0.001 by Student t-test).
Fig. 3
Fig. 3. Cell cycle effects of MLN4924 in RB.
a The indicated 5 RB cell lines were treated with DMSO for 72 h or 200 nM MLN4924 for 24, 48, and 72 h, and at each timepoint the cells were exposed to EdU for 30 min prior to fixation/permeabilization, click chemistry, DAPI staining, and flow cytometry to assess the effect on the cell cycle. A representative set of plots is shown. The gates ah represent cell cycle phases as explained in b. b Data from the assays in a was summarized in bar charts. Averages are plotted and error bars indicate the range of 2 assays. c Apoptosis of RB247 cells was confirmed by comparing Annexin V/dapi staining in vehicle (DMSO) vs. MLN4924 (200 nM) treated cells. A representative flow cytometry plot is shown and quantification is also graphed (n = 3 average +/− SD, ***P < 0.0001 by Student t-test). d Summary of the effects of MLN4924 on different RB cell lines.
Fig. 4
Fig. 4. Skp2 depletion mimics many of the effects of MLN4924.
a The listed siRNAs (color coded as indicated) were used to deplete the corresponding target in the six listed retinoblastoma cell lines (knockdown efficiency shown in Supplementary Fig. 3a). After 6 days, live cell counts were obtained, Westerns were run to quantify PARP cleavage (Supplementary Fig. 3a, b shows an example blot), FACs assays were run to define subG1 cells (see c for full cell cycle data, and Supplementary Fig. 3c for examples of the FACS plots), and the results, normalized to siCtrl, were displayed in heat maps (averages of two biological replicates are plotted). b Data from each of the siRNA assays in a were plotted against similar data obtained with MLN4924 (n = 2 average +/− range). The table summarizes the R and p values for each siRNA tested, and the graphs for siSKP2 are shown on the right. c Bar graphs summarizing data from FACS analysis on the five indicated cell lines treated with the indicated siRNAs, color-coded as in a (n = 2 average +/− range). Examples of the FACS plots are provided in Supplementary Fig. 3c. d Summary of the effects of drug vs. siSKP2 on cell cycle and survival in five RB lines. The cell lines are ordered most to least drug sensitive from top to bottom, respectively.

References

    1. Dimaras H, et al. Retinoblastoma. Nat. Rev. Dis. Prim. 2015;1:15021. - PMC - PubMed
    1. Munier FL, et al. Intravitreal chemotherapy for vitreous disease in retinoblastoma revisited: from prohibition to conditional indications. Br. J. Ophthalmol. 2012;96:1078–1083. - PubMed
    1. Francis JH, et al. The classification of vitreous seeds in retinoblastoma and response to intravitreal melphalan. Ophthalmology. 2015;122:1173–1179. - PubMed
    1. Shields CL, et al. Intravitreal melphalan for persistent or recurrent retinoblastoma vitreous seeds: preliminary results. JAMA Ophthalmol. 2014;132:319–325. - PubMed
    1. Corson TW, Gallie BL. One hit, two hits, three hits, more? Genomic changes in the development of retinoblastoma. Genes Chromosomes Cancer. 2007;46:617–634. - PubMed