. 2019 Oct;12(4):10.1103/physrevapplied.12.044076.
doi: 10.1103/physrevapplied.12.044076. Epub 2019 Oct 31.

QUANTIFICATION OF ACOUSTIC RADIATION FORCES ON SOLID OBJECTS IN FLUID

Affiliations

QUANTIFICATION OF ACOUSTIC RADIATION FORCES ON SOLID OBJECTS IN FLUID

Mohamed A Ghanem et al. Phys Rev Appl. 2019 Oct.

Abstract

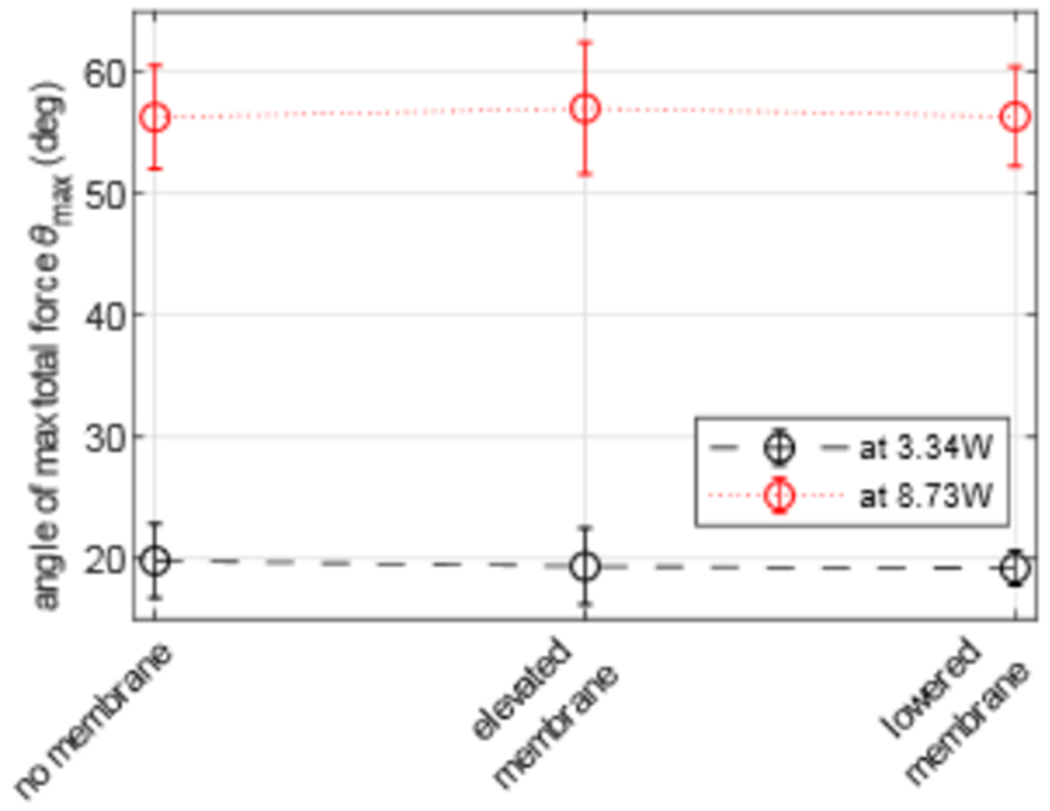
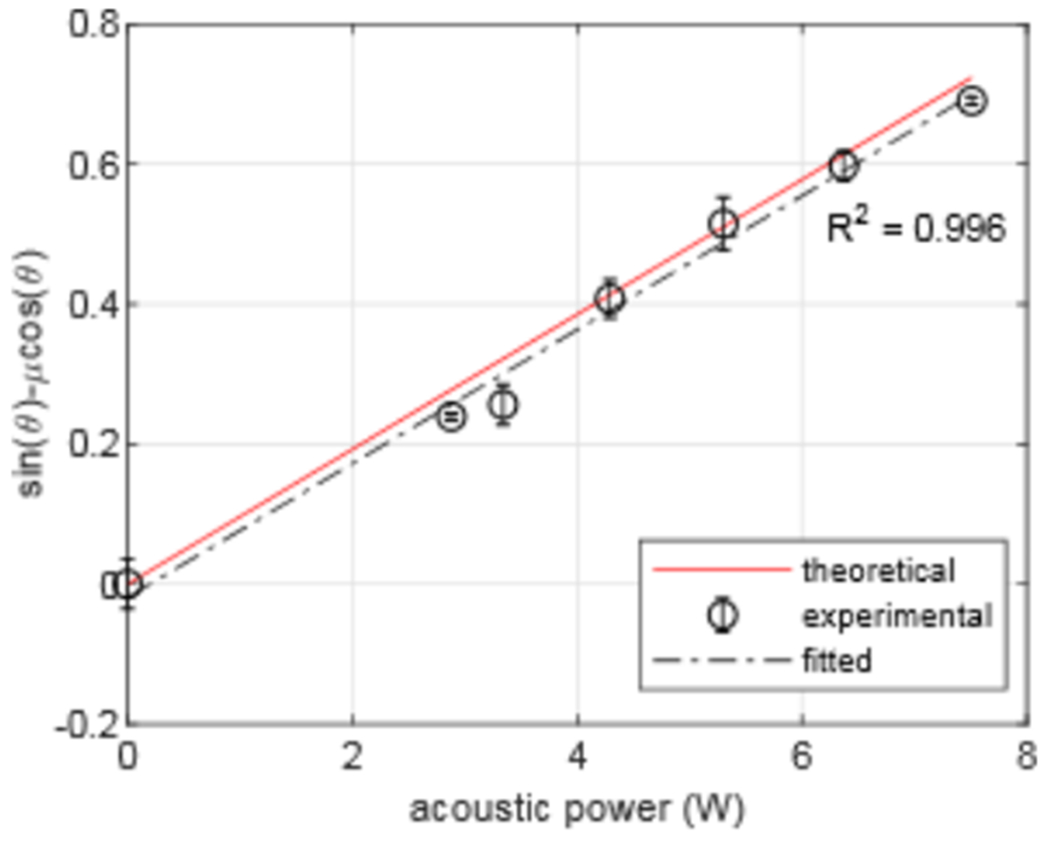
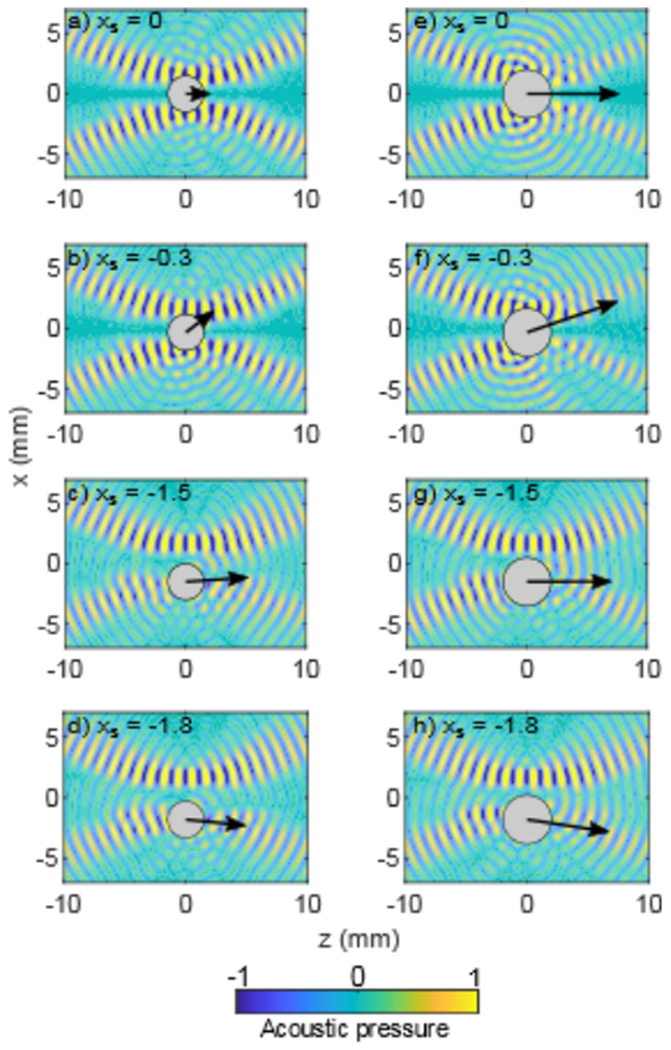
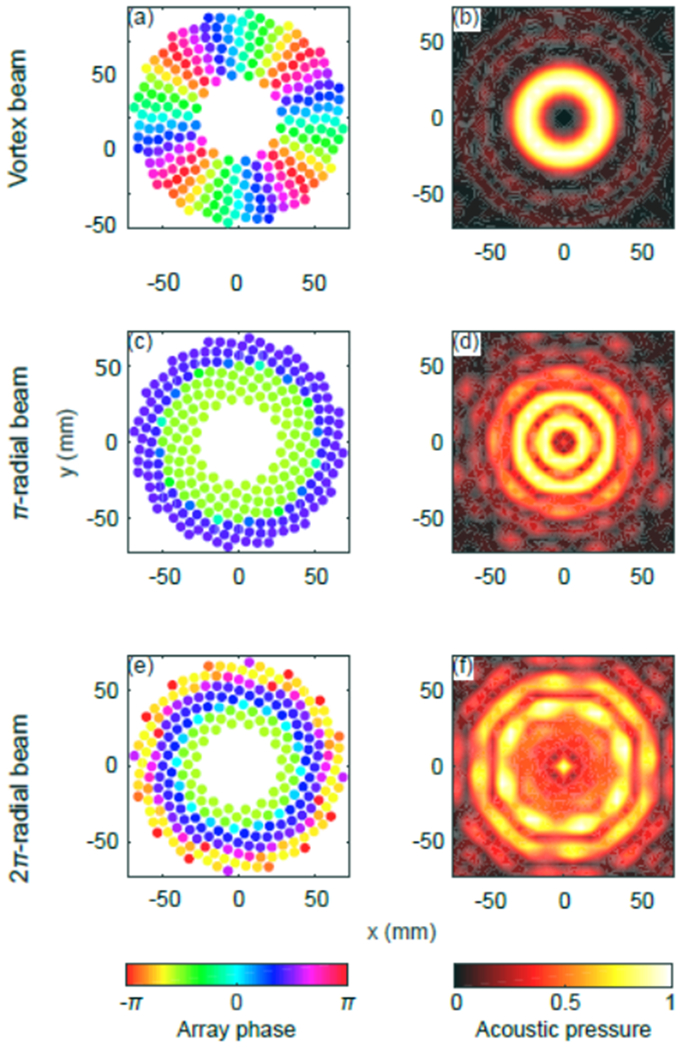
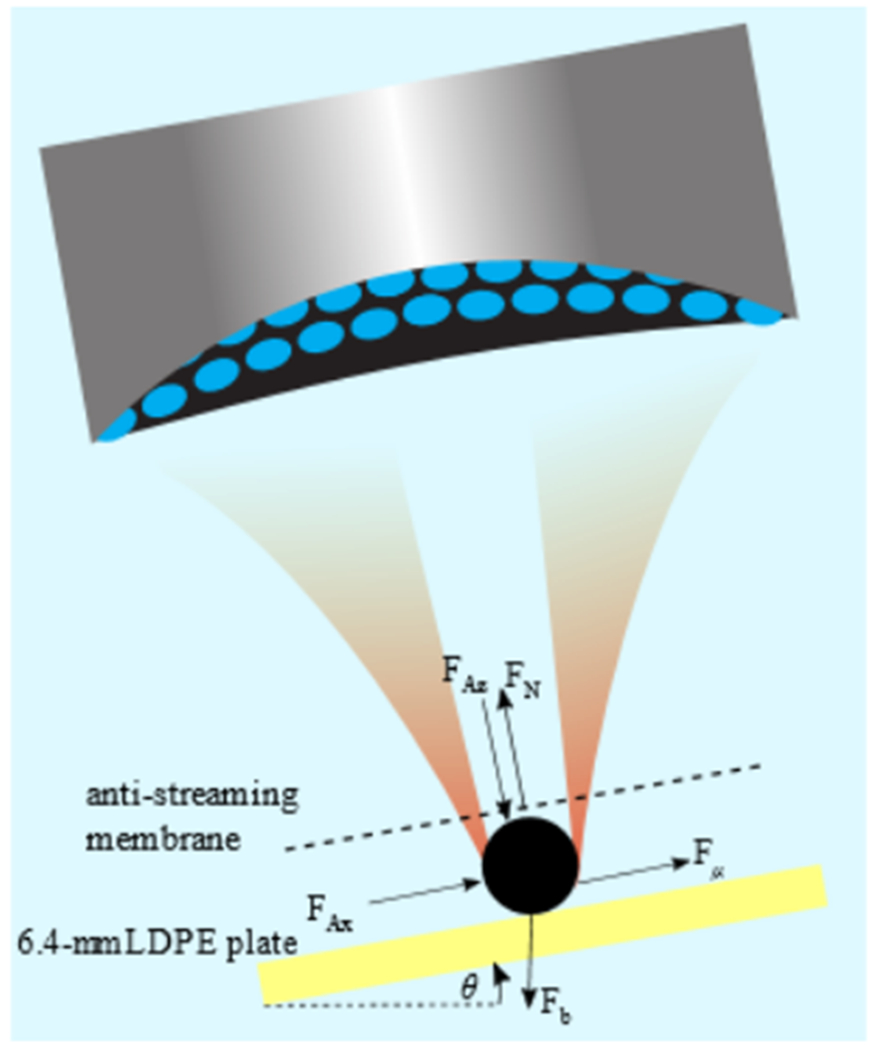
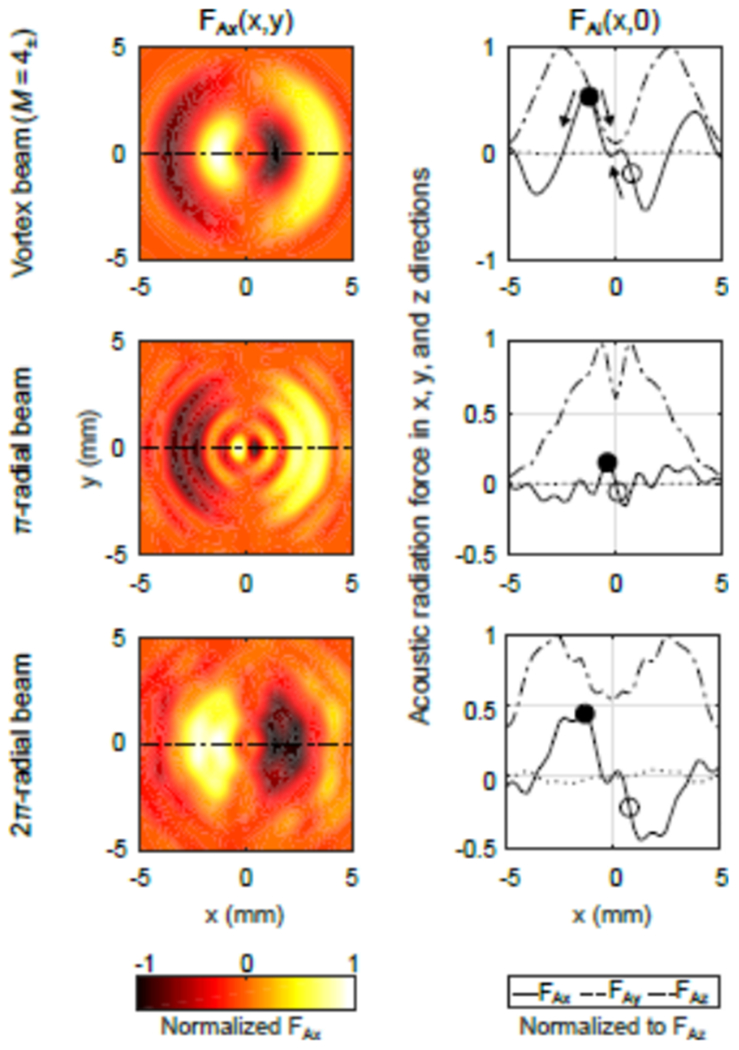
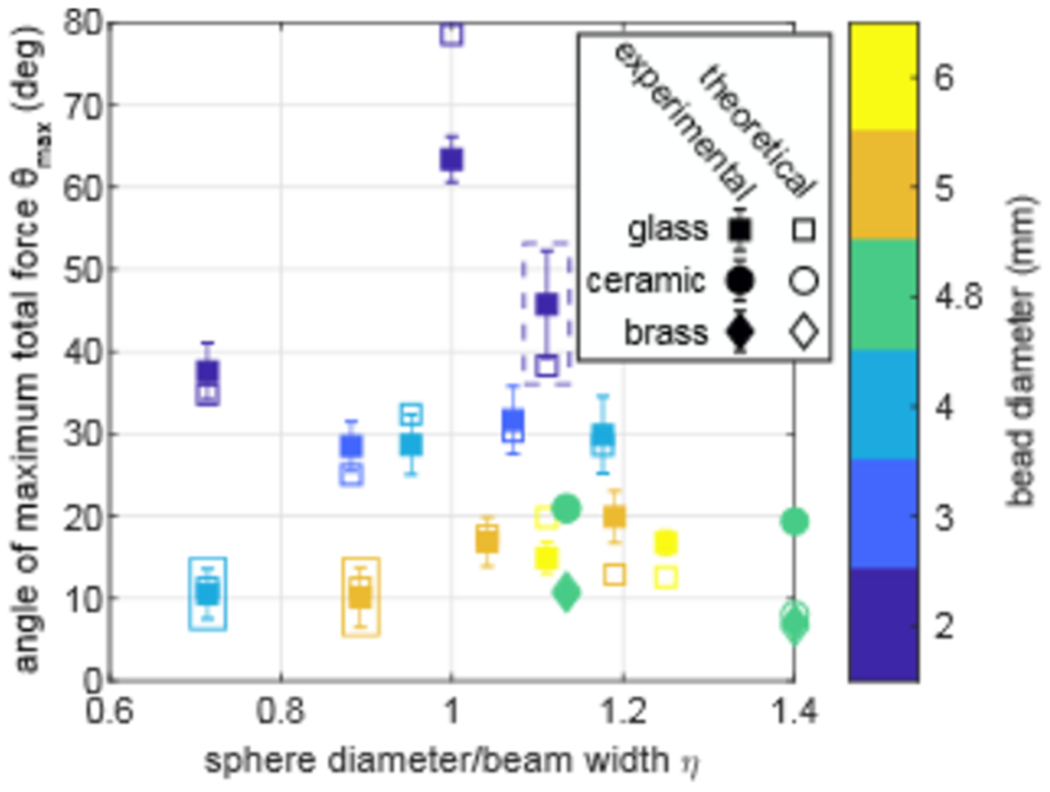
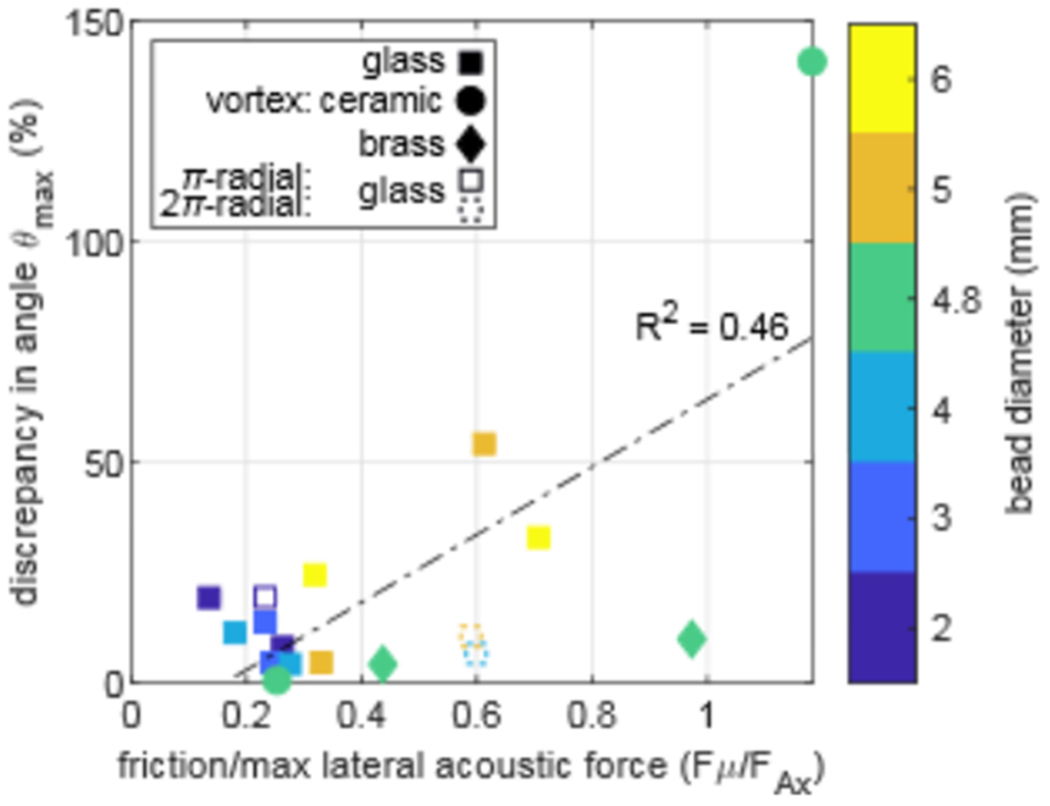
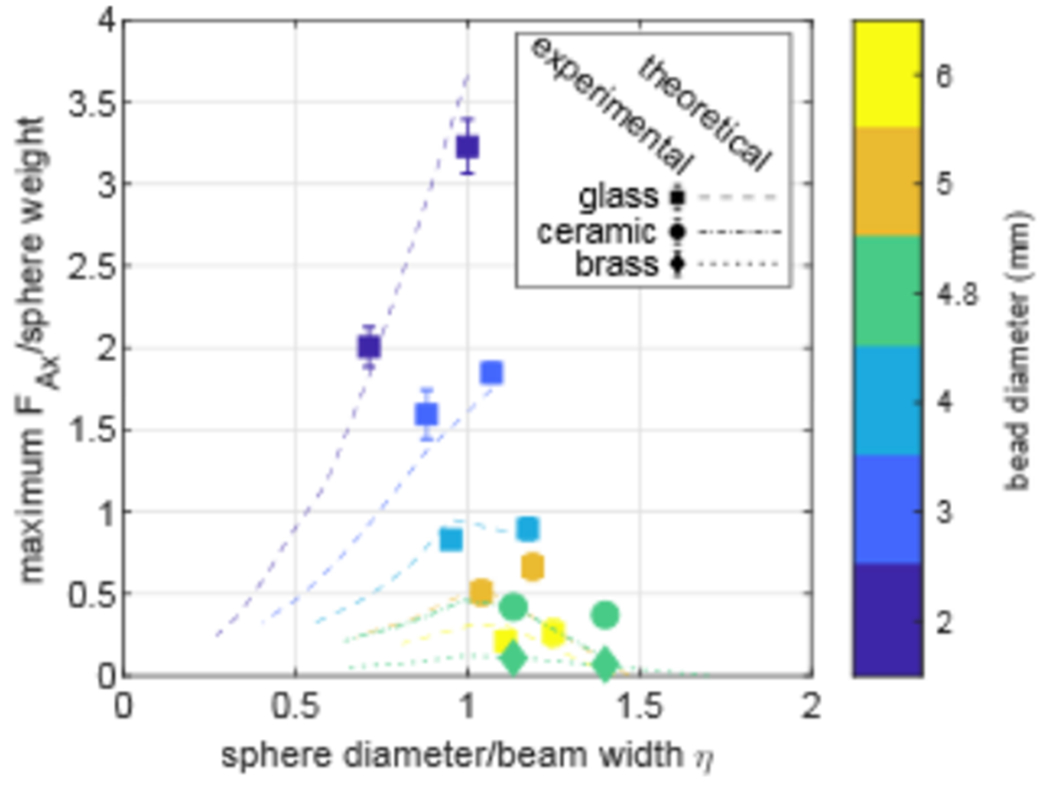
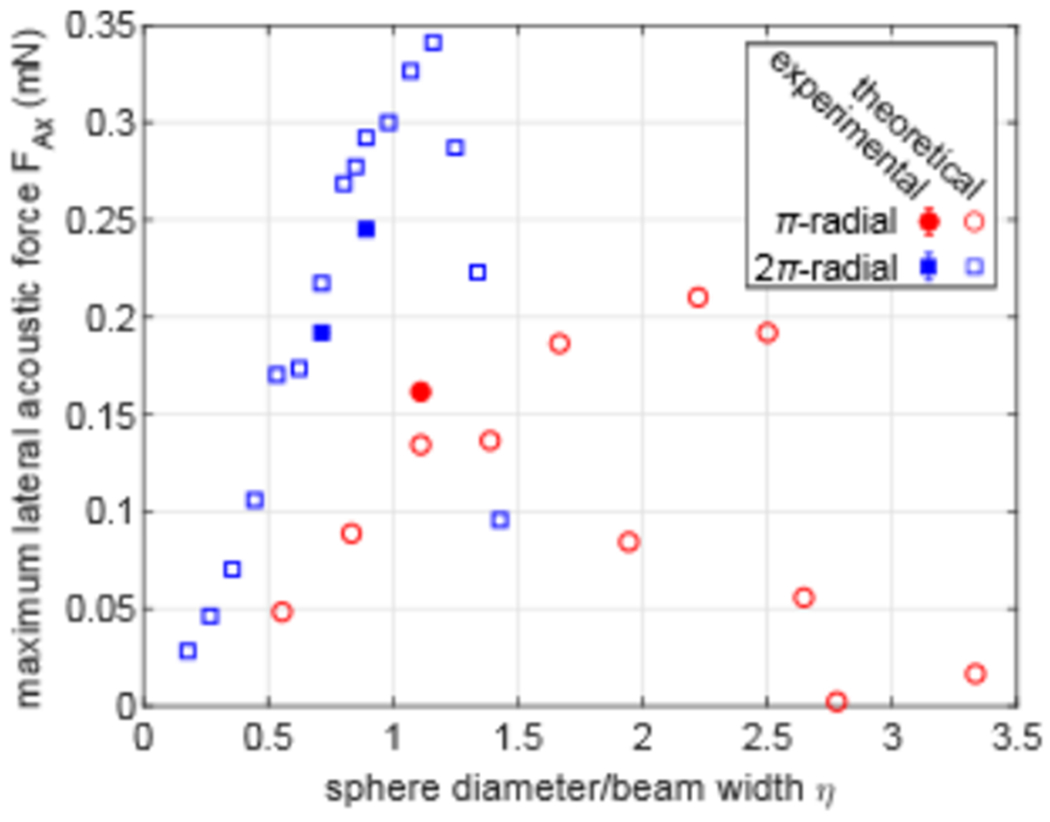
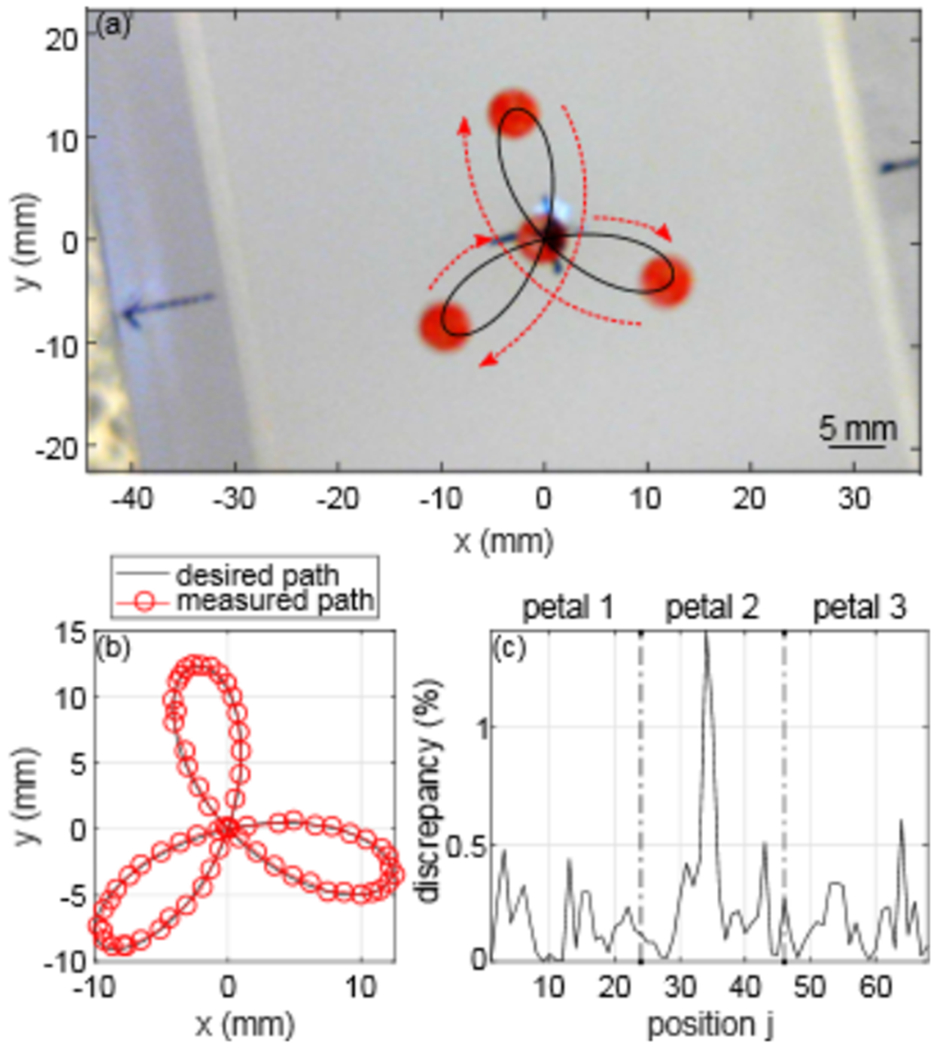
Theoretical models allow design of acoustic traps to manipulate objects with radiation force. Here, a model of the acoustic radiation force by an arbitrary beam on a solid object was validated against measurement. The lateral force in water of different acoustic beams was measured and calculated for spheres of different diameter (2-6 wavelengths λ in water) and composition. This is the first effort to validate a general model, to quantify the lateral force on a range of objects, and to electronically steer large or dense objects with a single-sided transducer. Vortex beams and two other beam shapes having a ring-shaped pressure field in the focal plane were synthesized in water by a 1.5-MHz, 256-element focused array. Spherical targets (glass, brass, ceramic, 2-6 mm dia.) were placed on an acoustically transparent plastic plate that was normal to the acoustic beam axis and rigidly attached to the array. Each sphere was trapped in the beam as the array with the attached plate was rotated until the bead fell from the acoustic trap because of gravity. Calculated and measured maximum obtained angles agreed on average to within 22%. The maximum lateral force occurred when the target diameter equaled the beam width; however, objects up to 40% larger than the beam width were trapped. The lateral force was comparable to the gravitation force on spheres up to 90 mg (0.0009 N) at beam powers on the order of 10 W. As a step toward manipulating objects, the beams were used to trap and electronically steer the spheres along a two-dimensional path.


Figures

FIG. A1.
FIG. A1.
Effect of acoustic streaming on the lateral trapping force measurement at two different power levels of 3.3 and 8.7 W versus three different anti-streaming membrane configurations. The angle of maximum total lateral force for a 5-mm glass bead did not significantly vary among configurations at either power level, which demonstrates the absence of acoustic streaming effects in the measurements.
FIG. B1.
FIG. B1.
Relationship between the acoustic power W and nondimensionalized factor corresponding to the acoustic radiation forces represented in terms of the angle of maximum total lateral force. Experimental data [open circles with error bars indicating standard deviation (N = 10)] show agreement with theoretical (solid line) estimates of the angle of maximum total lateral force. A best-fit line (dashed line) with a high correlation coefficient of R2 = 0.996 indicates good linearity of the measured data points.
FIG. 1.
FIG. 1.
Simulation illustrating the acoustic radiation force from the same vortex beam on 3-mm (a-d) and 4-mm (e-h) diameter solid glass spheres located near the acoustic beam axis. The acoustic wave propagates from left to right in the z direction, and with the color pattern displays the distribution of the instantaneous pressure. The location of the center of the sphere is indicated by xs in mm. The arrow indicates the direction and magnitude of the acoustic radiation force, which comprises x and y components. Depending on the sphere’s radial location, the resulting acoustic force either restores the sphere toward the center of the beam as in (b & f) or pushes the sphere out of the beam as in (d & h).
FIG. 2.
FIG. 2.
Three acoustic beam shapes used for trapping spherical beads: vortex (a-b), π-radial (c-d) and 2π-radial (e-f) beams. On the left, the phase of each element in the array is shown, and on the right the pressure field created on the transverse plane at the focus is shown. A vortex beam of M = 4 topological charge is shown here for illustration. The array phase of a vortex beam (a) has circumferential variation, while the array phase for the π-radial (c) and 2π-radial (e) beams varies along the radial direction. The normalized focal pressure (b, d, f) distribution in the xy-plane is shown for each case. Each beam creates in the focal plane a null and a ring of pressure with which to trap the sphere in the lateral direction while minimizing the axial radiation force.
FIG. 3.
FIG. 3.
Experimental setup showing the rotation of the frame-array combination until the spherical target rolled off at the angle of maximum total lateral force θmax. The diagram represents the static equilibrium equation used to calculate the lateral acoustic radiation force from the measured angle θmax. The coordinate system rotated with the array such that the x-axis was parallel to the LDPE plate, and the z-axis coincided with the acoustic axis.
FIG. 4:
FIG. 4:
Simulation of the lateral acoustic radiation force FAx normalized to its maximum on a 4-mm glass bead throughout the focal xy-plane for the 3 beams (left column). FAx for a vortex beam (a) is the average of the force produced by alternating M = 4 & −4. Within the visible rings, all beams create a positive FAx (light color) on the left, which pushes the bead to the right, and a negative FAx on the right, which pushes the bead to the left. In the center without any asymmetry in other forces, the net lateral acoustic radiation force holds the sphere in place effectively trapping it. The right column displays the acoustic radiation forces FAx, FAy, and FAz normalized to the maximum FAz value at different sphere locations along the x-axis (the dashed line of the left column). The open and solid dots show centroid positions of the 4-mm sphere within the trap. With the rotation of the array-platform system, because of an increasing effect of gravity with slope, the sphere will roll from the location of the open dot to the location of the solid dot, which is the position of maximum lateral acoustic force that is pushing to the right in this case. Further increase in angle will cause the bead to fall from the trap.
FIG. 5.
FIG. 5.
Comparison between the measured and calculated predicted angle θmax versus the ratio of sphere diameter to beam width η. Experimental data are the mean, and error bars show the standard deviation of ten replicate measurements. Close proximity of solid and open marks shows the good agreement between measurement and theory over a range of bead sizes and compositions. Different compositions are denoted by different data point shapes. Data point pairs within the dashed rectangle are for the π-radial beam and within the solid rectangle are for the 2π-radial beam, which both have a fixed beam width. Sphere diameters are shown by color, and M was adjusted to alter the beam width and create the η displayed. Overall calculations with the SB model compare well to measurement for different beams, sphere diameters, and sphere compositions.
FIG. 6.
FIG. 6.
Discrepancy between calculated and measured angles plotted versus the ratio of friction to theoretical maximum lateral acoustic force. The discrepancy in angle is 21.8±32.4% on average, and agreement is good. There appears to be a correlation between the discrepancy, and the friction component suggesting the error in friction is a factor in the discrepancy although the correlation is weak.
FIG. 7.
FIG. 7.
Ratio of maximum lateral acoustic force FAx to sphere weight in a 10-W vortex beam versus the ratio of sphere diameter to beam width η. Theoretical lines connect a few discrete values calculated for discrete values of M and therefore discrete beam widths for a specific sphere diameter and composition. Theoretical lines are also truncated where there was no lateral acoustic radiation force as the sphere was too large. Regardless of the sphere material, the most efficient trapping occurred at η close to 1.
FIG. 8.
FIG. 8.
Maximum lateral acoustic force FAx of 10-W π and 2π radially-varying phase beams versus the ratio of the sphere diameter to beam width η. FAx diminishes for small or large η. The π-radial beam rings have the same acoustic intensity, and both can trap spheres as FAx reaches a maximum close to η = 1 and 2. The 2π-radial follows a smoother shape where maximum FAx is centered at η ≈ 1, since the inner ring has higher intensity and is the effective trapping ring.
FIG. 9.
FIG. 9.
The trapping by an M = 6± vortex beam and dynamic steering of a 5-mm glass sphere (a) over a path defined by Eq. (4), where the bead starts at the center, then moves to the right and follows the red arrows around each petal and back to the center. Good agreement is shown in (b) between the theoretical path (black line) and measured path (shown as open dots drawn around the center of the sphere from every frame of the video). The discrepancy in radius is shown in (c) between the measured and intended motion plotted versus each programmed position of the path as defined in Eq. (4).

References

    1. Ashkin A, Phys. Rev. Lett 24, 156 (1970).
    1. Ashkin A, Dziedzic JM, Bjorkholm JE, and Chu S, Opt. Lett 11, 288 (1986). - PubMed
    1. Ashkin A, Dziedzic JM, and Yamane T, Nature 330, 769 (1987). - PubMed
    1. Jing P, Wu J, Liu GW, Keeler EG, Pun SH, and Lin LY, Sci. Rep 6, 1 (2016). - PMC - PubMed
    1. Wang MD, Yin H, Landick R, Gelles J, and Block SM, Biophys. J 72, 1335 (1997). - PMC - PubMed

LinkOut - more resources