. 2020 Apr 17;48(7):3678-3691.
doi: 10.1093/nar/gkaa140.

Atm deficiency in the DNA polymerase β null cerebellum results in cerebellar ataxia and Itpr1 reduction associated with alteration of cytosine methylation

Affiliations

Atm deficiency in the DNA polymerase β null cerebellum results in cerebellar ataxia and Itpr1 reduction associated with alteration of cytosine methylation

Jusik Kim et al. Nucleic Acids Res. .

Abstract

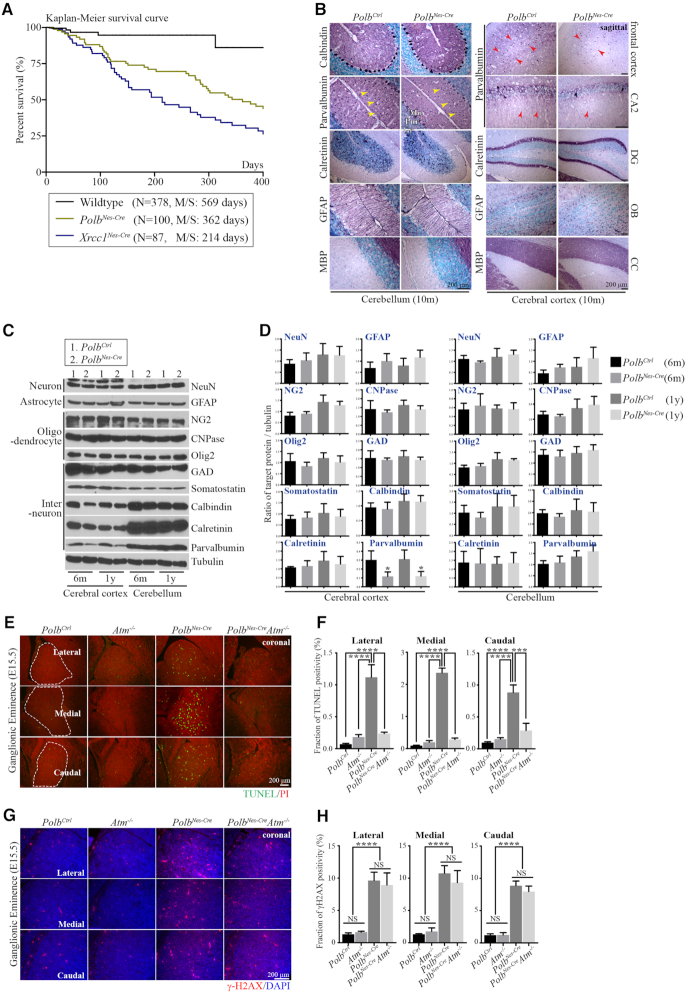
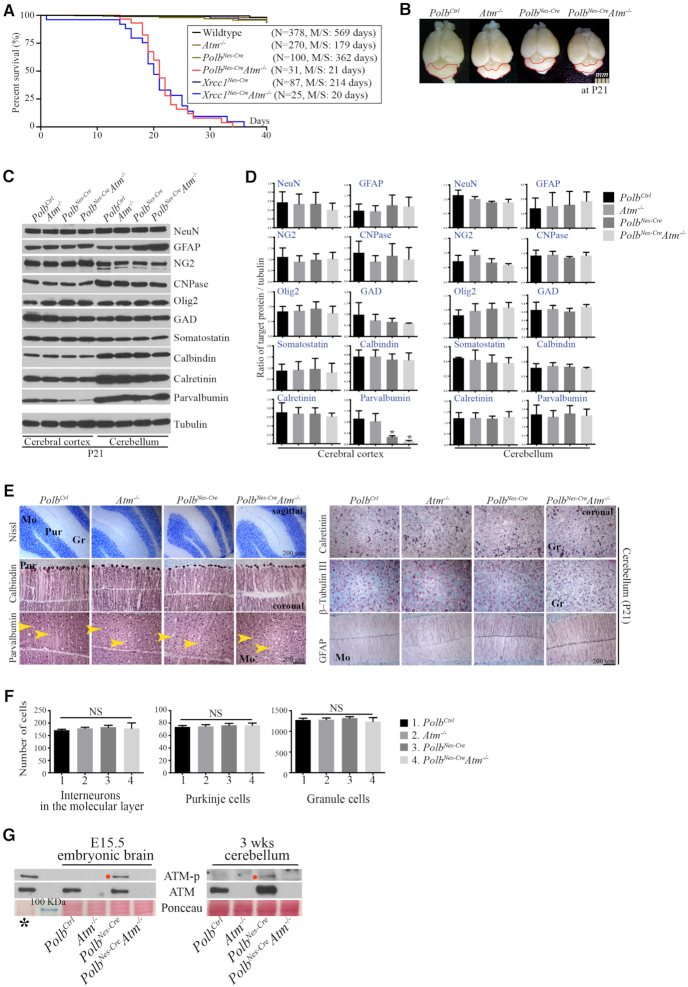
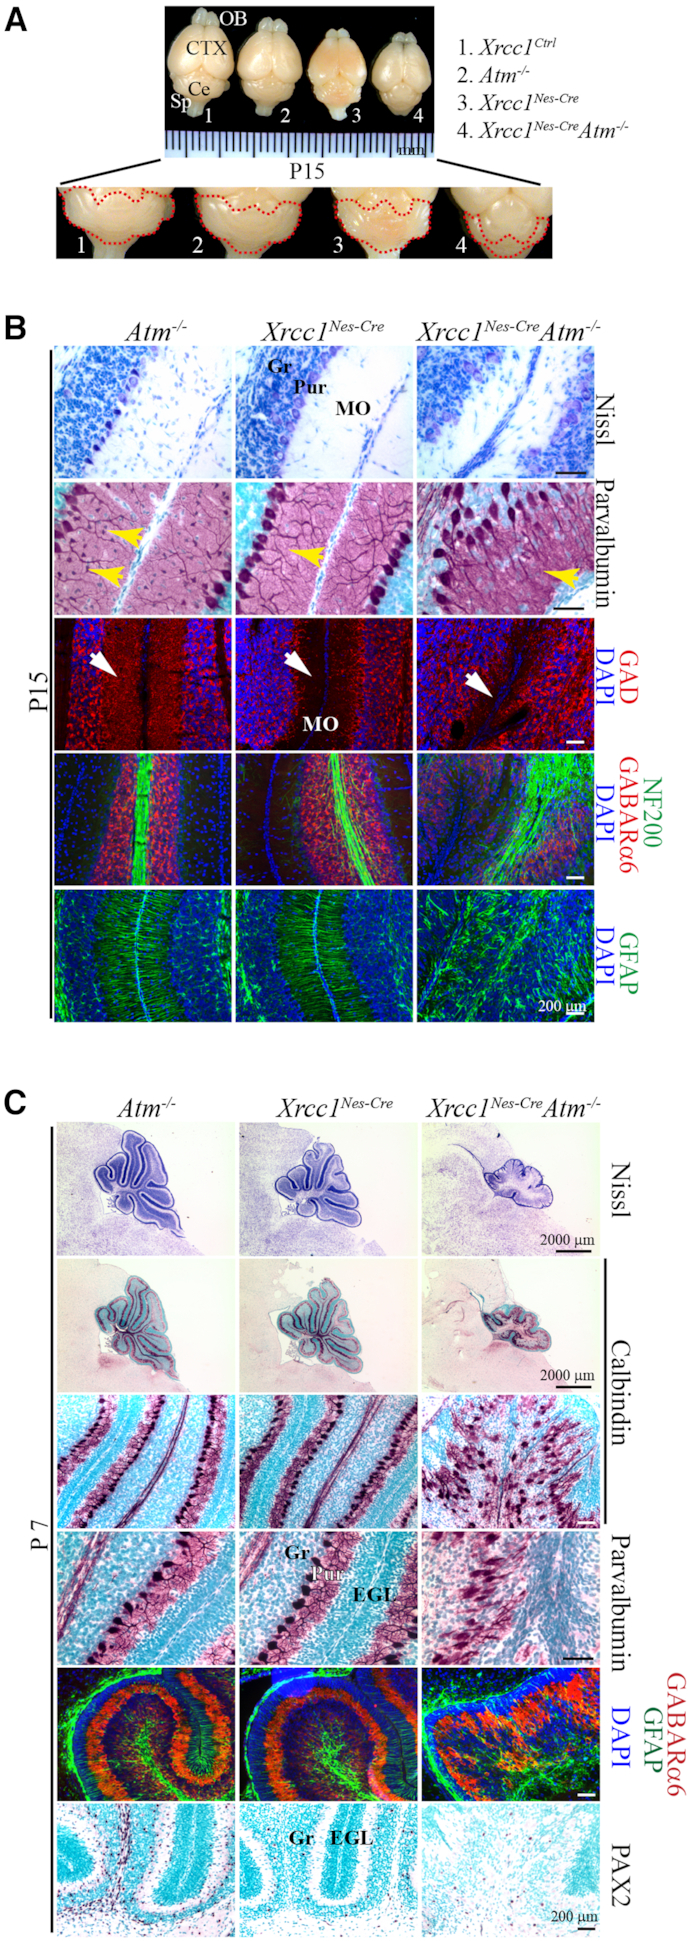
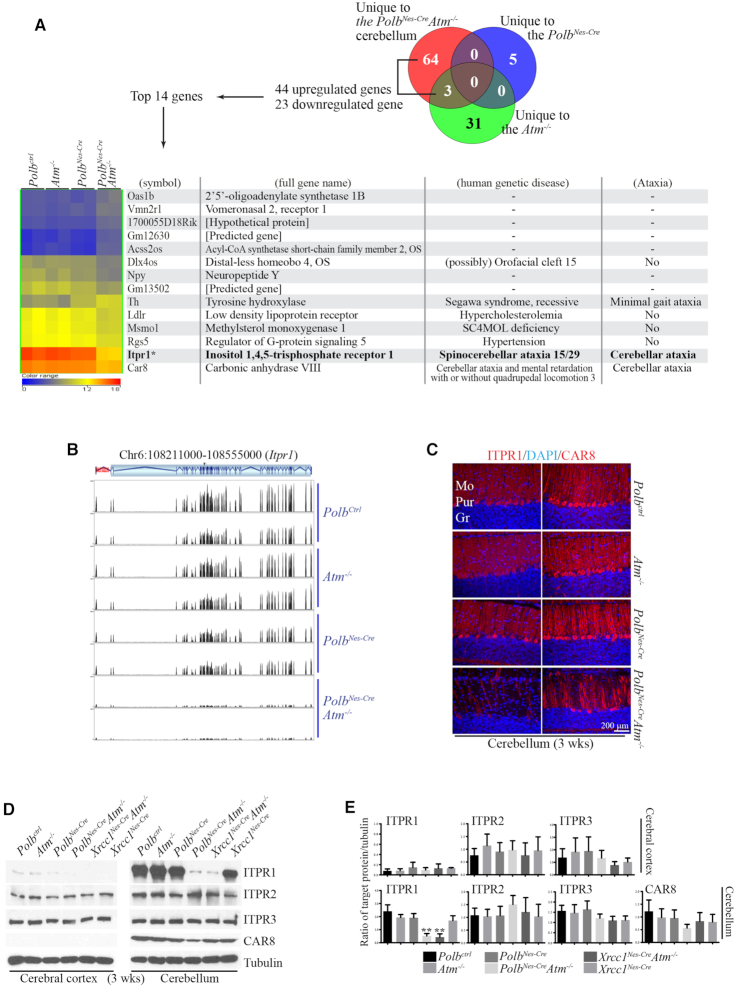
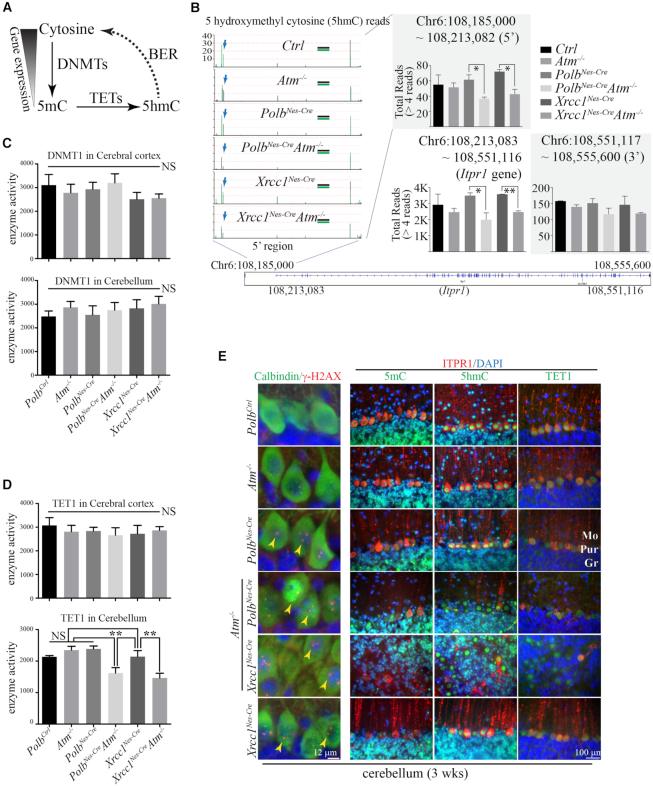
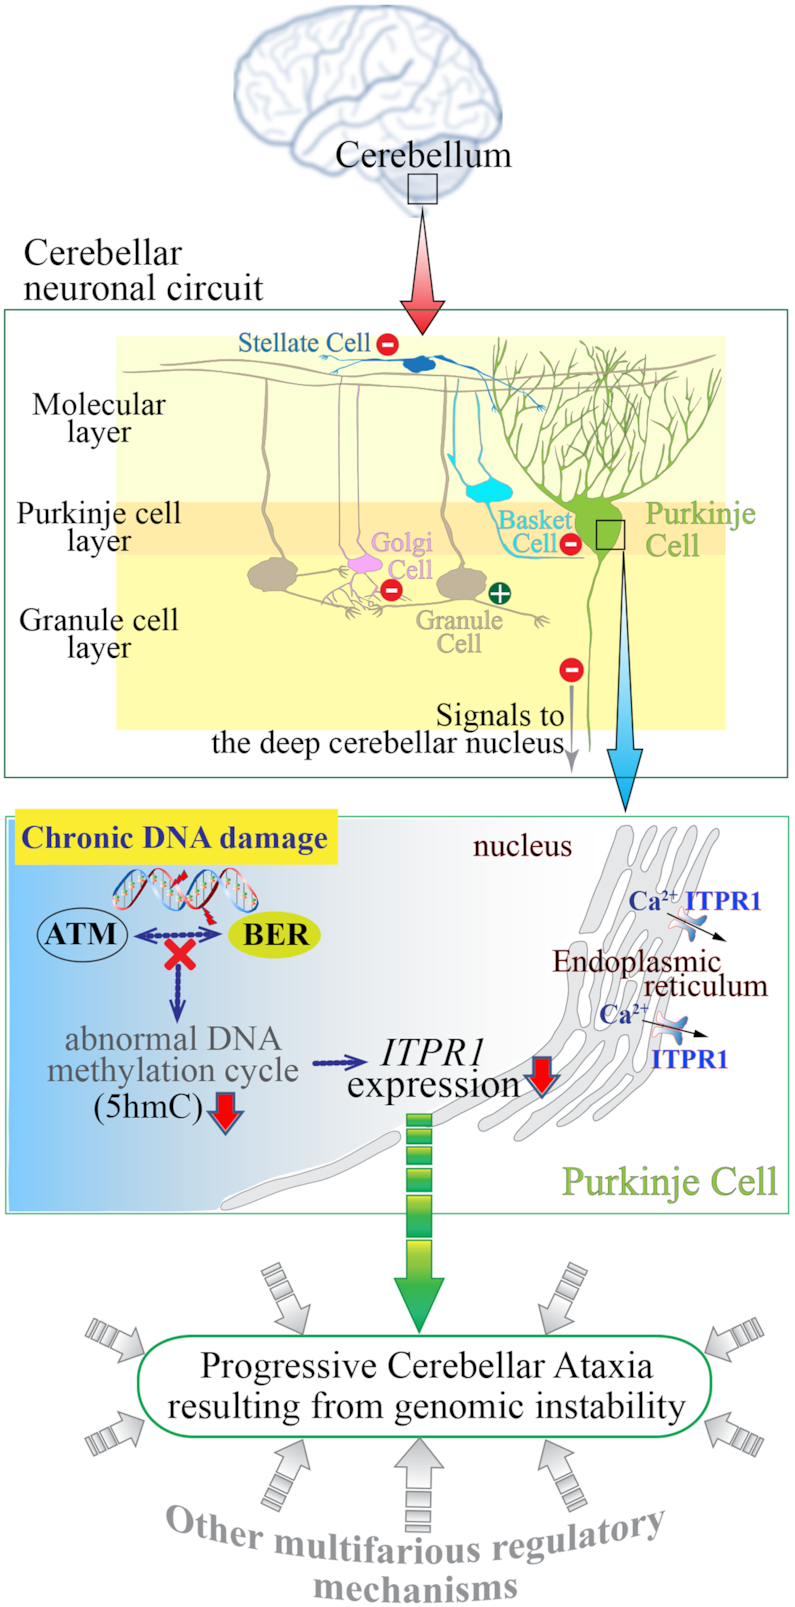
Genomic instability resulting from defective DNA damage responses or repair causes several abnormalities, including progressive cerebellar ataxia, for which the molecular mechanisms are not well understood. Here, we report a new murine model of cerebellar ataxia resulting from concomitant inactivation of POLB and ATM. POLB is one of key enzymes for the repair of damaged or chemically modified bases, including methylated cytosine, but selective inactivation of Polb during neurogenesis affects only a subpopulation of cortical interneurons despite the accumulation of DNA damage throughout the brain. However, dual inactivation of Polb and Atm resulted in ataxia without significant neuropathological defects in the cerebellum. ATM is a protein kinase that responds to DNA strand breaks, and mutations in ATM are responsible for Ataxia Telangiectasia, which is characterized by progressive cerebellar ataxia. In the cerebella of mice deficient for both Polb and Atm, the most downregulated gene was Itpr1, likely because of misregulated DNA methylation cycle. ITPR1 is known to mediate calcium homeostasis, and ITPR1 mutations result in genetic diseases with cerebellar ataxia. Our data suggest that dysregulation of ITPR1 in the cerebellum could be one of contributing factors to progressive ataxia observed in human genomic instability syndromes.


Figures

Figure 1.
Figure 1.
Polb inactivation during neurogenesis does not affect overall brain development. (A) Kaplan–Meier survival curve. Polb inactivation in the nervous system (PolbNes-Cre) of the mouse was associated with a shorter life span than in wild-type animals, yet it was longer than that in Xrcc1 conditional (Xrcc1Nes-Cre; Xrcc1 inactivation in the nervous system using a Nestin-Cre line) animals. N indicates the number of animals observed for the analysis. M/S, median survival days. (B) Histopathological analysis of adult (10 months old [10 m]) cerebella and cerebral cortices (sagittal plane). There was no difference between the control (Ctrl) and PolbNes-Cre brains, except for fewer parvalbumin-positive interneurons and axons (red arrow heads) in the PolbNes-Cre cerebral cortex. There was also no sign of cerebellar interneuron loss (yellow arrow heads) in the PolbNes-Cre cerebellum, which is one of the major neural defects found in the Xrcc1 null cerebellum (7). CA2, Cornu ammonis area 2 of the hippocampus; DG, Dentate gyrus of the hippocampus; OB, Olfactory bulb; CC, Corpus Callosum; Mo, Molecular layer in the cerebellum; Pur, Purkinje cell layer in the cerebellum; Gr, Granule cell layer in the cerebellum. (C and D) Western blots (C) and quantification (D) analyses of several neural markers in the cerebral cortices and cerebella of mice at 6 months (6 m) and 1 year (1 y) of age, which show no defects in the PolbNes-Cre animals except for reduced parvalbumin in the PolbNes-Cre cerebral cortices, not in the cerebella. The protein levels of indicated markers were measured using ImageJ (densitometry) and were normalized to those of tubulin (D). N = 3. All bars indicate mean ± SEM; *, P < 0.05. Neuronal marker, (NeuN); Astrocyte marker, (GFAP); Oligodendrocyte marker, (NG2, CNPase, Olig2); Interneuron/specialized neuronal marker, (GAD, Somatostatin, Calbindin, Calretinin, Parvalbumin). (E and F) Apoptosis detected by TUNEL (Green staining, E) and corresponding quantification (F) in the lateral, medial and caudal Ganglionic Eminence at E15.5 (coronal plane). Neural apoptosis was found only in the PolbNes-Cre Ganglionic Eminence, which disappeared in an Atm−/− background. TUNEL positivity was measured using ImageJ in the demarcated areas (white dotted lines) from multiple embryonic sections (F). Counter staining: Propidium Iodide (PI). N = 4 (Ctrl), N = 3 each (each genetic backgrounds). All bars indicate mean ± SEM; ****, P < 0.001; ***, P < 0.005. (G and H) DNA damage visualized as γ-H2AX foci formation (red punctate staining, (G) and corresponding quantification (H) in the lateral, medial and caudal Ganglionic Eminence at E15.5 (coronal plane). The amounts of DNA damage are similar in the PolbNes-Cre and PolbNes-CreAtm−/− Ganglionic Eminence, and were negligible in control (Ctrl) and Atm−/− embryos. γ-H2AX foci were measured using ImageJ in several 150-μm2 areas from multiple embryonic sections (H). Counter staining: 4′,6-diamidino-2-phenylindole (DAPI). N = 4 (Ctrl), 3 (Atm−/−, PolbNes-Cre) and 2 (PolbNes-CreAtm−/−). All bars indicate mean ± SEM; ****, P < 0.001; NS, not significant.
Figure 2.
Figure 2.
Polb and Atm double inactivation results in severe ataxia without significant neuropathological defects in the cerebellum. (A) Kaplan–Meier survival curve. The PolbNes-CreAtm−/− animals did not live beyond 3–4 weeks of age, similar to the Xrcc1Nes-CreAtm−/− animals. Polb/Atm and Xrcc1/Atm double conditional knockout animals were both severely ataxic. N indicates the number of animals observed for the analysis. M/S, median survival days. (B) Gross view of the brains in different genetic backgrounds at postnatal day (P) 21. The red lines demarcate the cerebellum, which shows no difference in size. (C and D) Western blot analysis of several neural markers in the cerebral cortices and cerebella at P21 (C) and quantification analyses of neural markers (D). No abnormal expression was found in either PolbNes-Cre or PolbNes-CreAtm−/− brains except for cortical parvalbumin (C). Atm deficiency was not sufficient to rescue reduced parvalbumin expression in the PolbNes-Cre cerebral cortex. The protein levels of indicated neural markers were measured using ImageJ (densitometry) and were normalized to those of tubulin (F). N = 3. All bars indicate mean ± SEM; *, P < 0.05. (E and F) Histopathological analysis of the cerebellum at P21 (E) (sagittal and coronal planes). In the cerebella of PolbNes-CreAtm−/− animals that showed severe ataxia, the Purkinje cell layer detected by calbindin immunopositivity (quantified in F) is normally organized, and parvalbumin-(yellow arrowheads, quantified in D) and calretinin-positive interneurons are intact. Increased GFAP immunoreactivity (Bergmann glia) in the PolbNes-Cre and PolbNes-CreAtm−/− cerebella is visible, which is a common feature among animal models of genomic instability. Interneurons in the molecular layer, Purkinje cells and granule cells were counted (D) in numerous 0.27-mm2 areas (0.07 mm2 for granule cells; Nissl staining [C]) of the matched cerebellar parts, which show no difference. Counter staining: methyl Green. N = 4 (Ctrl), N = 3 each (other genetic backgrounds). All bars indicate mean ± SEM; NS, not significant; Mo, Molecular layer; Gr, Granule cell layer; Pur, Purkinje cell layer. (G) ATM phosphorylation (ATM-p) was observed only in the Polb inactivated embryonic brain at E15.5 and in the Polb null cerebellum at 3 weeks (wks) of age. The red dots indicate mouse ATM phosphorylated at serine 1987. * ionizing radiated (10Gy) murine thymus as a positive control. The blue line indicates a 100-kDa molecular weight marker.
Figure 3.
Figure 3.
Atm inactivation in the Xrcc1Nes-Cre brain results in abnormal cerebellum. (A) Gross view of the brains of mice from different genetic backgrounds (control, Atm−/−, Xrcc1Nes-Cre, Xrcc1Nes-CreAtm−/−) at P15. The red lines demarcate the cerebellum. The size of the cerebellum was reduced in the Xrcc1Nes-CreAtm/- mice. OB, Olfactory bulb; CTX; Cerebral cortex; Ce, Cerebellum; Sp, Spinal cord. (B) Histopathological analysis of the cerebellum at P15. GAD (glutamate decarboxylase) immunoreactivity is for the GABAergic neuron network, and NF200 (neurofilament 200) immunoreactivity is for neurons. The Xrcc1Nes-CreAtm−/− cerebella showed signs of interneuron loss (yellow arrows, parvalbumin positive interneurons; white arrows, GABAergic neurons) in the molecular layer, similarly to the Xrcc1Nes-Cre cerebella, suggesting that interneuron loss in Xrcc1 deficiency is ATM independent and p53 dependent (7). Gr, Granule cell layer; Pur, Purkinje cell layer; MO, Molecular layer. (C) Histopathological analysis of the cerebella of Atm−/−, Xrcc1Nes-Cre, and Xrcc1Nes-CreAtm−/− animals at P7 (sagittal plane), when the Purkinje cells are in a single-cell layer and foliation of all cerebellar lobules are noticeable. Nissl staining shows the overall structure of the cerebellar vermis. Calbindin immunoreactivity for the Purkinje cell layer, parvalbumin immunoreactivity for interneurons in the molecular layer and Purkinje cells, GABARa6 immunoreactivity for the granule cell layer, GFAP immunoreactivity for the Bergmann glia network, and PAX2 immunoreactivity for interneurons in the cerebellum are shown. The Atm null cerebellum was normal for the formation of Purkinje and granule cell layers and for the interneuron population. The Xrcc1Nes-Cre cerebellum also showed normal development except for fewer interneurons (PAX2-positive cells) as described before (7). However, the Purkinje cell layer was not properly organized in the Xrcc1Nes-CreAtm−/− cerebellum, which was smaller and less foliated. Also, PAX2-positive interneurons were not rescued in the Xrcc1Nes-CreAtm−/− cerebellum. Gr, Granule cell layer; EGL, External germinal layer; Pur, Purkinje cell layer.
Figure 4.
Figure 4.
Itpr1 expression is reduced the most in the cerebella of PolbNes-CreAtm−/− and Xrcc1Nes-CreAtm−/− animals that show severe ataxia. (A) Hierarchical cluster analysis of cerebellar RNAseq data. The Venn diagram indicates the numbers of genes significantly and uniquely up- or downregulated in each mutant cerebellum. Hierarchical clustering of the top 14 genes among 44 upregulated and 23 downregulated genes unique to the PolbNes-CreAtm−/− cerebellum is shown. The color scale of the normalized expression values ranges from 0 (blue) to 12 (yellow) to 18 (red). The gene list also includes related human genetic disease information obtained from the public database (http://omim.org and http://rarediseases.info.nih.gov). The most differentially expressed gene in the PolbNes-CreAtm−/− cerebellum was Itpr1, compared with that in the control, Atm−/− and PolbNes-Cre cerebella at 3 weeks of age. ITPR1 mutations or deletions are responsible for Spinocerebellar ataxia 15/29 or Gillespie syndrome. (B) RNAseq profiling of Itpr1 in the mouse cerebellum at 3 weeks of age; the Itpr1 gene is located on chromosome 6 (Chr6) 108,213,083–108,551,116. The vertical lines in the gene structure indicate exons, and the zigzag lines indicate introns. The black peaks matched with exon locations represent the normalized RNAseq reading (y-axis scale, 0–1900), and these peaks are negligible in the PolbNes-CreAtm−/− cerebellum, indicating the reduction of Itpr1 expression in this particular genetic background. (C) Immunostainings of ITPR1 and CAR8, which are highly and exclusively expressed in the Purkinje cell layer of the cerebellum (coronal plane). ITPR1 immunopositivity is almost absent in the PolbNes-CreAtm−/− cerebellum. Also reduced CAR8 staining is visible in the double knockout cerebellum. Mo, Molecular layer; Pur, Purkinje cell layer; Gr, Granule cell layer. (D and E) Western blots (D) and quantification (E) analyses for ITPR1, ITPR2, ITPR3 and CAR8 in the cerebral cortices and cerebella at 3 weeks of age. A dramatic reduction of ITPR1 is evident only in the PolbNes-CreAtm−/− and Xrcc1Nes-CreAtm−/− cerebella. Both PolbNes-CreAtm−/− and Xrcc1Nes-CreAtm−/− animals displayed severe ataxia. The expressions of ITPR1 and CAR8 in the cerebral cortex were barely detected. The protein levels of indicated proteins were measured using ImageJ (densitometry) and were normalized to those of tubulin (E). N = 3. All bars indicate mean ± SEM; **, P < 0.01.
Figure 5.
Figure 5.
Epigenetic regulation likely contributes to Itpr1 reduction in the PolbNes-CreAtm−/− and Xrcc1Nes-CreAtm−/− cerebella. (A) Simplified diagram of DNA methylation cycle. Cytosine in DNA is methylated by DNMTs (DNA methyltransferases) to become 5mC (5-methylcytosine), whose levels are inversely correlated with gene expression. 5mC is oxidized by TETs (Ten-eleven translocation methylcytosine dioxygenases), into 5hmC (5-hydroxymethylcytosine). This chemically modified cytosine is recognized for base excision repair (BER) (POLB and XRCC1 are involved) and then is eventually restored to cytosine. Thus, BER participates in the regulation of gene expression. (B) The repetitive 5hmC reads and locations on the Itpr1 gene on chromosome (Chr) 6 from the reduced representation hydroxymethylation profiling (RRHP) analyses. The total reads of 5hmC (>4 reads) in the 5′ (108,185,000 –108,213,082 [promoter, magnified]), Itpr1 gene (108,213,083–108,551,116) and 3′ (108,551,117–108,555,600) regions were calculated. In the magnified portion, two plots (in black and green) were overlaid for each genetic background, and the vertical lines indicate the locations of 5hmC and the amounts of repetitive reads. The blue arrows indicate one of several 5hmC sites that were reduced in both PolbNes-CreAtm−/− and Xrcc1Nes-CreAtm−/− cerebella. In the graphs, all bars for total 5hmC reads in the marked regions indicate mean ± SEM; **, P < 0.01; *, P < 0.05. (C and D) DNMT1 (C) and TET1 (D) enzyme activities in the cerebral cortices and cerebella of mice from six different genetic backgrounds at 3 weeks of age. Chemiluminescence readings for enzyme activity in triplicates (repeated twice) were normalized by protein quantity. There is less enzyme activity of TET1 detected in both PolbNes-CreAtm−/− and Xrcc1Nes-CreAtm−/− cerebella, than in the other genetic backgrounds. N = 4 each (all genetic backgrounds). All bars indicate mean ± SEM; **, P < 0.01; NS, not significant. (E) Immunohistochemical analyses of 5mC, 5hmC and TET1 with ITPR1 immunoreactivity as well as DNA damage visualized by nuclear γ-H2AX foci in Purkinje cells (calbindin positive) of the cerebellum (sagittal and coronal planes). TET1 is strongly expressed and localized in the nuclei of the Purkinje cells. Similarly strong nuclear 5hmC staining is evident in the Purkinje cells, which showed DNA damage (γ-H2AX foci, yellow arrowheads) only in the Polb and Xrcc1 null cerebellum regardless of the status of Atm, and not in the Ctrl and Atm−/− cerebellum. Nuclear 5mC immunoreactivity was not as robust as that of 5hmC in the Purkinje cells. Reduced ITPR1 immunoreactivity in the Xrcc1Nes-CreAtm−/− cerebellum is apparent. Mo, Molecular layer; Pur, Purkinje cell layer; Gr, Granule cell layer.
Figure 6.
Figure 6.
Schematic diagram showing the consequences of genomic instability resulting from defective BER and ATM deficiency in the cerebellum leading to ataxia. The cerebellum, which is located at the back of the brain and is involved in the coordination of motor movement, comprises distinct cellular layers: the molecular layer, Purkinje layer and granule cell layer. Purkinje cell axons transmit inhibitory signals (−) to the deep cerebellar nucleus while integrating inhibitory inputs (−) from interneurons (Stellate and Basket cells) in the molecular layer and excitatory inputs (+) from Granule cells which are under the inhibitory control (−) of Golgi cells in the granule cell layer, as well as (+) inputs from the climbing fibers (not shown). As the only neuronal output is from the Purkinje cells, their dysfunction leads to abnormal coordination of movement (ataxia). Improper responses to chronic DNA damage in the cerebellum due to faulty base excision repair (BER) and ATM dysfunction likely result in various defects, including aberrant DNA methylation and consequently reduced ITPR1 expression in Purkinje cells. ITPR1 is involved in homeostatic control of Ca2+ levels necessary for normal Purkinje cell function (54). This physiological condition might be one of contributing factors to cerebellar ataxia resulting from genomic instability.

References

    1. Lee Y., Choi I., Kim J., Kim K.. DNA damage to human genetic disorders with neurodevelopmental defects. J. Genet. Med. 2016; 13:1–13.
    1. McKinnon P.J. Genome integrity and disease prevention in the nervous system. Genes Dev. 2017; 31:1180–1194. - PMC - PubMed
    1. Blackford A.N., Jackson S.P.. ATM, ATR, and DNA-PK: The trinity at the heart of the DNA damage response. Mol. Cell. 2017; 66:801–817. - PubMed
    1. McKinnon P.J., Caldecott K.W.. DNA strand break repair and human genetic disease. Annu. Rev. Genomics Hum. Genet. 2007; 8:37–55. - PubMed
    1. Madabhushi R., Pan L., Tsai L.H.. DNA damage and its links to neurodegeneration. Neuron. 2014; 83:266–282. - PMC - PubMed

Publication types