. 2020 Aug;227(4):1097-1108.
doi: 10.1111/nph.16454. Epub 2020 Mar 3.

Variation in photosynthetic induction between rice accessions and its potential for improving productivity

Affiliations

Variation in photosynthetic induction between rice accessions and its potential for improving productivity

Liana G Acevedo-Siaca et al. New Phytol. 2020 Aug.

Abstract

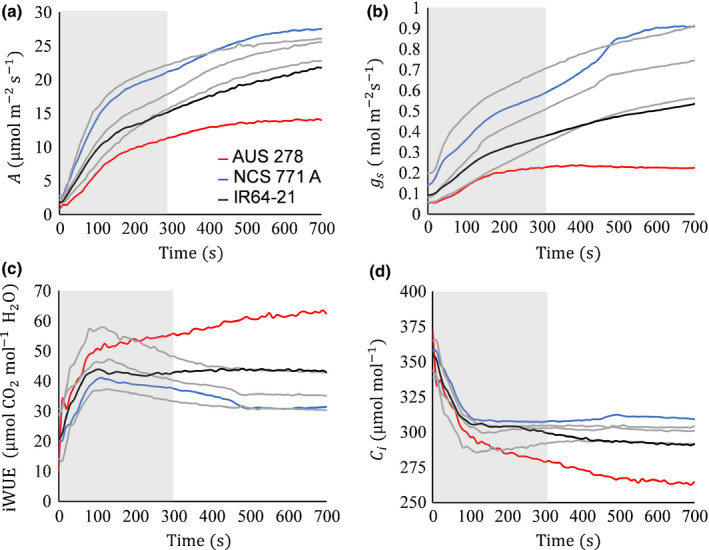
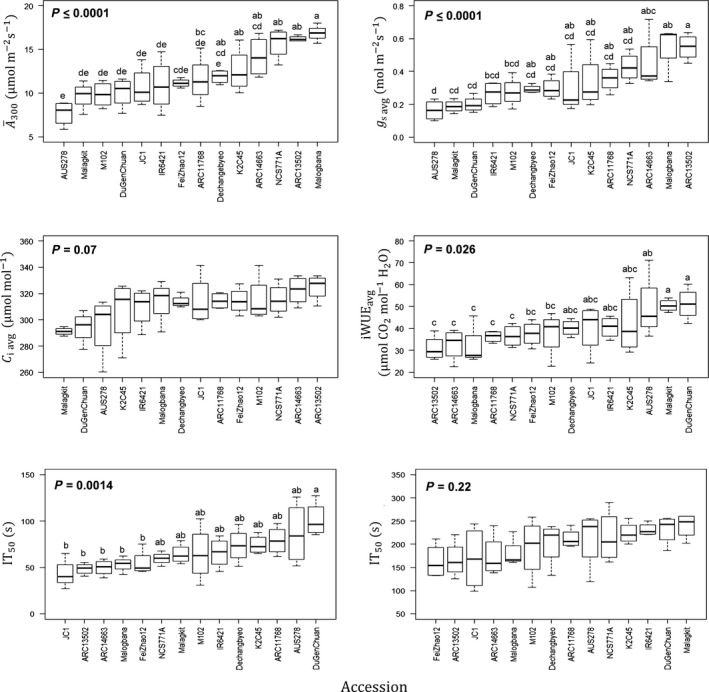
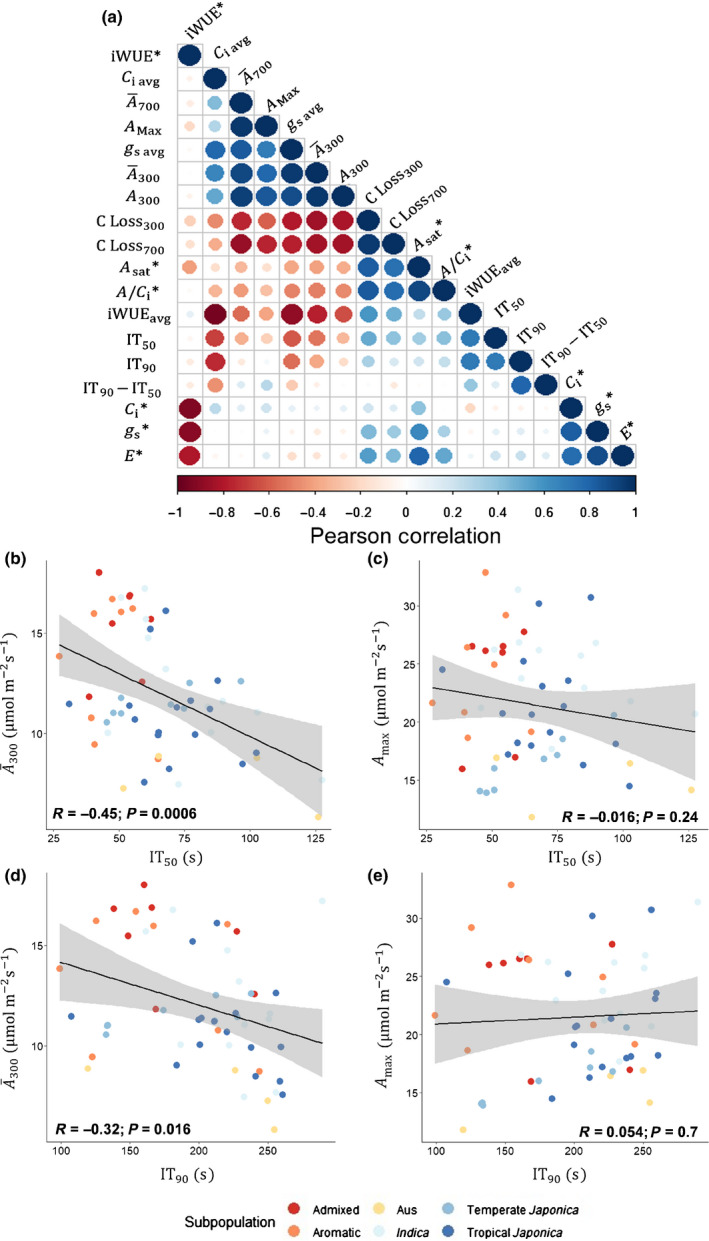
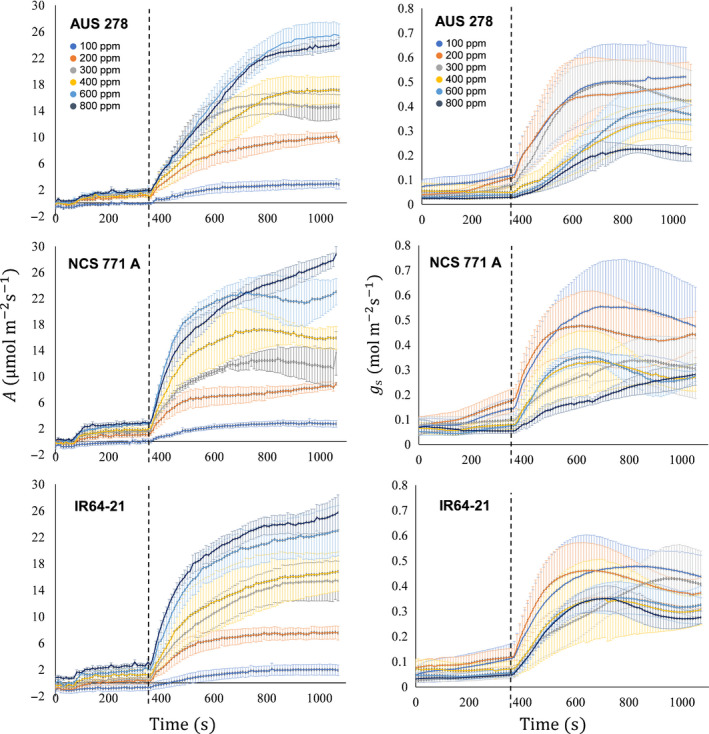
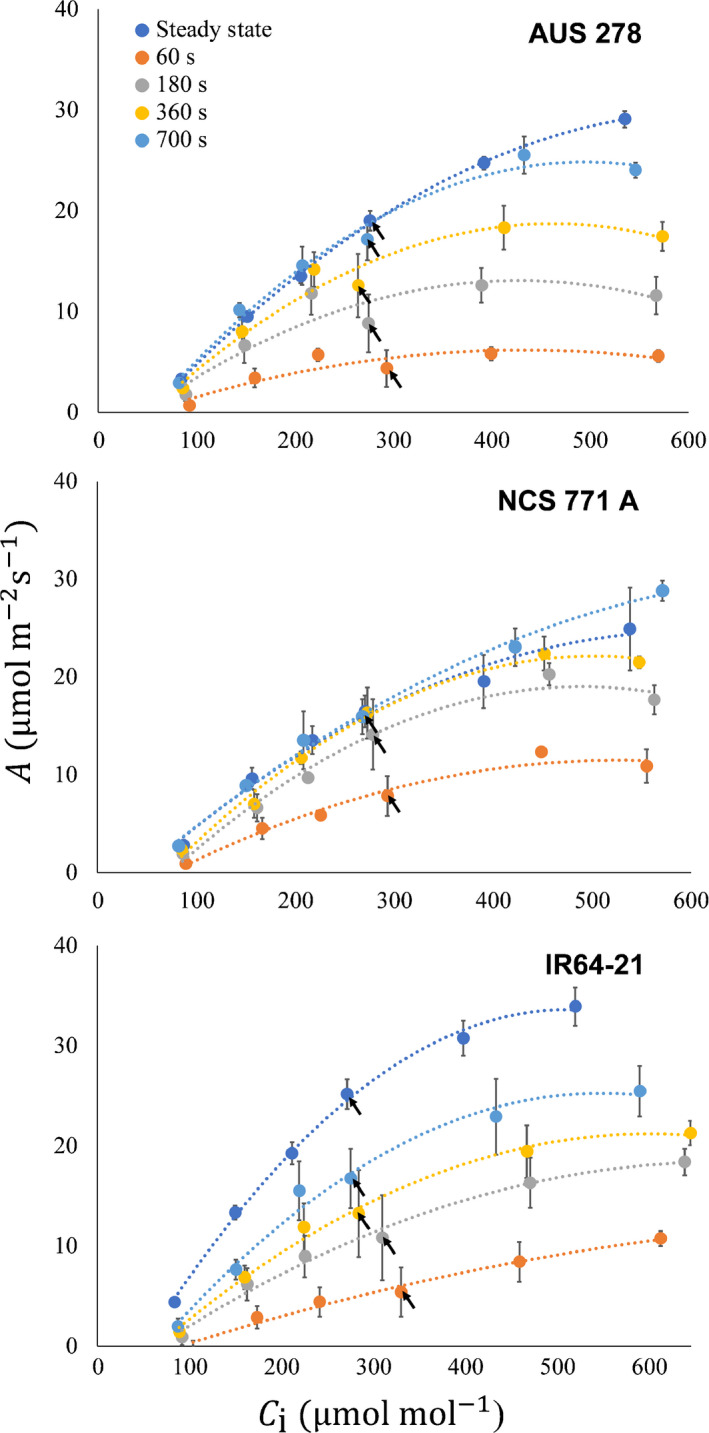
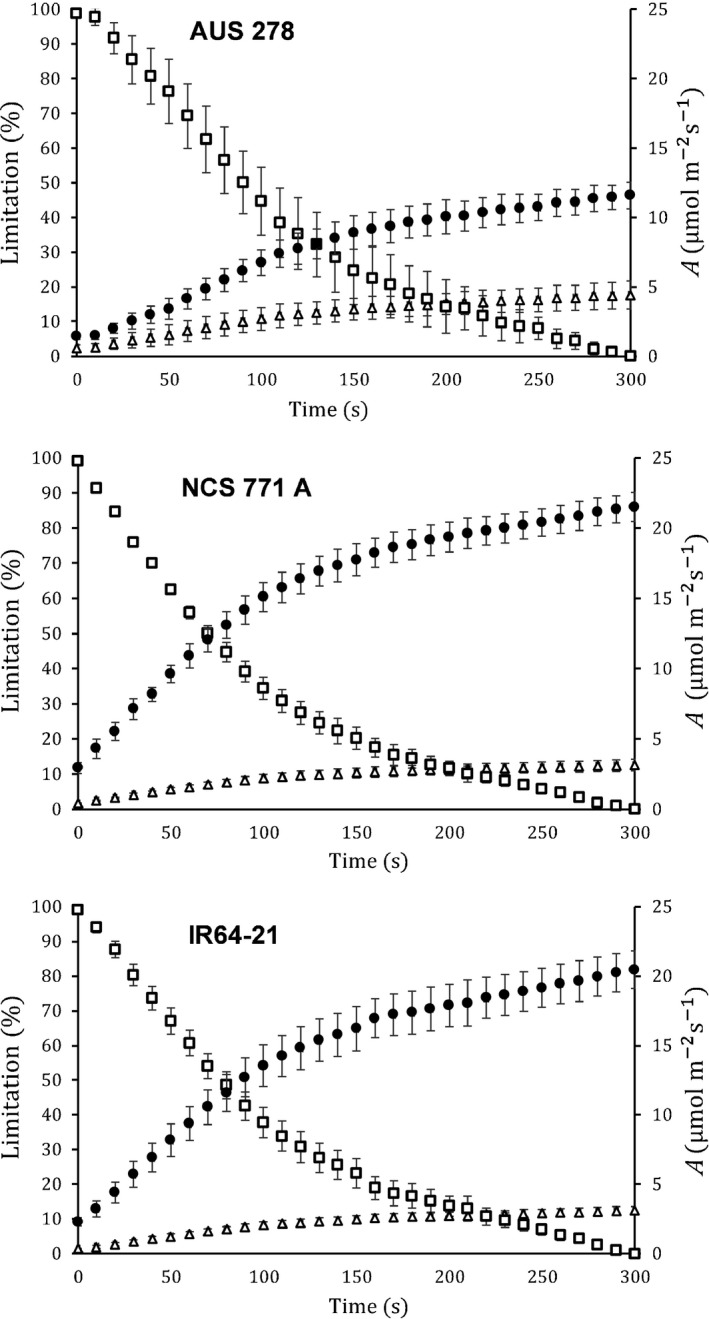
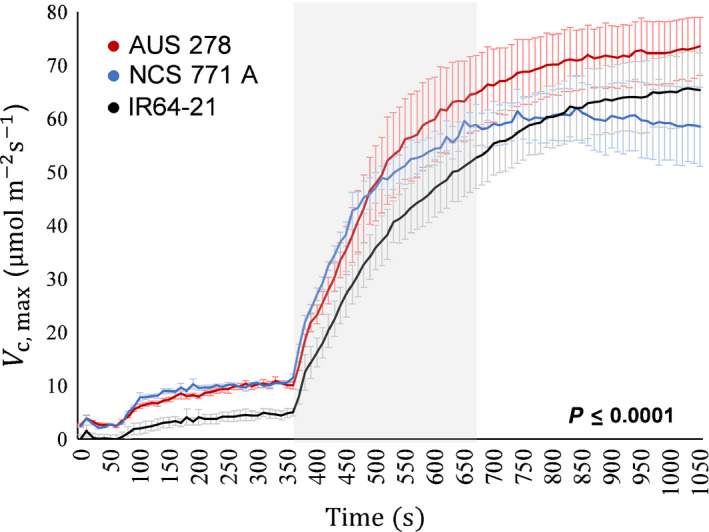
Photosynthetic induction describes the transient increase in leaf CO2 uptake with an increase in light. During induction, efficiency is lower than at steady state. Under field conditions of fluctuating light, this lower efficiency during induction may cost > 20% of potential crop assimilation. Accelerating induction would boost photosynthetic and resource-use efficiencies. Variation between rice accessions and potential for accelerating induction was analysed by gas exchange. Induction during shade to sun transitions of 14 accessions representing five subpopulations from the 3000 Rice Genome Project Panel (3K RGP) was analysed. Differences of 109% occurred in the CO2 fixed during the first 300 s of induction, 117% in the half-time to completion of induction, and 65% in intrinsic water-use efficiency during induction, between the highest and lowest performing accessions. Induction in three accessions with contrasting responses (AUS 278, NCS 771 A and IR64-21) was compared for a range of [CO2 ] to analyse limitations. This showed in vivo capacity for carboxylation at Rubisco (Vc,max ), and not stomata, as the primary limitation to induction, with significant differences between accessions. Variation in nonsteady-state efficiency greatly exceeded that at steady state, suggesting a new and more promising opportunity for selection of greater crop photosynthetic efficiency in this key food crop.

Keywords: Rubisco activase; dynamic photosynthesis; food security; photosynthesis; photosynthetic induction; rice; stomata; water-use efficiency.


Figures

Figure 1
Figure 1
(a) Net leaf CO2 uptake A, (b) stomatal conductance g s, (c) intrinsic water use efficiency iWUE = A/g s, and (d) intercellular [CO2] C i with time t of induction on transfer at 0 s from low to high light (50–1700 µmol m−2 s−1) in rice (Oryza sativa). The ‘induction period’, characterized by a steep increase in A, is demarked with the grey box and lasted up to 300 s. The three accessions that were selected for further study of induction at varied [CO2] were AUS 278 (red), NCS 771 A (blue) and IR64‐21 (black). The other three accessions in grey are Du Gen Chuan, K2 C45 and Malogbana. For ease of visualization, only six accessions are included, but the data for all 14 accessions are available in Table 1 and Fig. 2.
Figure 2
Figure 2
Mean and variation for all rice (Oryza sativa) accessions for average leaf CO2 uptake during the first 300 s of induction (A¯300), average A stomatal conductance during the first 300 s of induction (g s avg), average intrinsic water‐use efficiency (iWUEavg=A¯300/gs avg), average intercellular CO2 concentration during the first 300 s (C i avg), and time that A reached 50% and 90% of A 300 (IT50 and IT90, respectively). The accessions are ranked by increasing mean for each parameter. Different letters represent statistically significant differences (P < 0.05) between different accessions.
Figure 3
Figure 3
(a) Pearson correlation R 2 of all measured dynamic and steady‐state (*) photosynthetic traits measured in rice (Oryza sativa). Negative correlations (red) and positive (blue). Traits are as follows: A¯300 and A¯700, average A during the first 300 s an 700 s of induction, respectively; A sat, light‐saturated leaf CO2 uptake; g s, stomatal conductance; C i, intercellular [CO2] at steady state; iWUE, intrinsic water‐use efficiency (iWUE = A/g s); g s avg, average stomatal conductance during the first 300 s of induction; iWUEavg, average intrinsic water‐use efficiency (iWUE=A¯300/gs avg); C i avg, average intercellular [CO2] during the first 300 s; A 300, A at 300 s into induction; A Max, maximum rate of CO2 uptake across the entire induction period; IT50 and IT90, time that A reached 50% and 90%, respectively, of A 300; IT90  − IT50, the difference between IT90 and IT50; C Loss300=(A-A¯300)×300, the difference between the total uptake that would have occurred over the first 300 , if A had risen instantaneously to A 300 less the integral of the actual A over the first 300 s; C Loss700=(A-A¯700)×700. (b–e) Individual measures, regression line, correlation coefficient R 2, confidence interval (95%), and P‐value for (b) A¯300 vs IT50, (c) A¯300 vs IT90, (d) A Max vs IT50, and (e) A Max vs IT90.
Figure 4
Figure 4
Induction of leaf CO2 uptake A and stomatal conductance g s at [CO2] = 100, 200, 300, 400, 600 and 800 µmol mol−1 for three rice (Oryza sativa) cultivars. Each point is the mean (± SE) of four plants. The dashed vertical line at 360 s represents the point of transition from low to high photosynthetic photon flux density (50–1700 µmol m−2 s−1); that is, the start of induction.
Figure 5
Figure 5
The responses of leaf CO2 uptake A to intercellular [CO2] C i at steady state (dark blue), and at 60 s (orange), 180 s (grey), 360 s (yellow), and 700 s (light blue) from the start of induction and replotted from Fig. 4. The operating point of each curve at 400 µmol mol−1 atmospheric [CO2] C a is indicated with a black arrow. Each point is the mean (± SE) of four plants of each rice (Oryza sativa) accession.
Figure 6
Figure 6
Nonstomatal (open squares) and stomatal (closed triangles) limitations with leaf CO2 uptake A (closed circles) vs time over the first 300 s of induction for the three selected rice (Oryza sativa) accessions. Nonstomatal and stomatal limitations during induction were calculated relative to the near‐steady‐state value obtained at 300 s. Each point represents the mean (± SE) of four individual plants measured at ambient [CO2].
Figure 7
Figure 7
Apparent maximum rate of carboxylation V c,max with time through induction calculated from the response of leaf CO2 uptake A to intercellular [CO2] C i derived from inductions made at different [CO2], as in Fig. 4. Induction began at 360 s. Significance of difference between the three rice (Oryza sativa) accessions is based on a repeated measures (time) one‐way ANOVA. Each point represents the mean (± SE) of four individual plants.

Comment in

References

    1. Ainsworth EA. 2008. Rice production in a changing climate: a meta‐analysis of responses to elevated carbon dioxide and elevated ozone concentration. Global Change Biology 14: 1642–1650.
    1. Burgess AJ, Retkute R, Preston SP, Jensen OE, Pound MP, Pridmore TP, Murchie EH. 2016. The 4‐dimensional plant: effects of wind‐induced canopy movement on light fluctuations and photosynthesis. Frontiers in Plant Science 7: e1392. - PMC - PubMed
    1. von Caemmerer S, Farquhar GD. 1981. Some relationships between the biochemistry of photosynthesis and the gas‐exchange of leaves. Planta 153: 376–387. - PubMed
    1. Cai C, Yin X, He S, Jiang W, Si C, Struik PC, Luo W, Li G, Xie Y, Pan G. 2015. Responses of wheat and rice to factorial combinations of ambient and elevated CO2 and temperature in FACE experiments. Global Change Biology 22: 856–874. - PubMed
    1. Carmo‐Silva E, Scales JC, Madgwick PJ, Parry MAJ. 2014. Optimizing Rubisco and its regulation for greater resource use efficiency. Plant, Cell & Environment 38: 1817–1832. - PubMed

Publication types

LinkOut - more resources