. 2020 Jun 1;130(6):3188-3204.
doi: 10.1172/JCI128313.

PIK3Cδ expression by fibroblasts promotes triple-negative breast cancer progression

Affiliations

PIK3Cδ expression by fibroblasts promotes triple-negative breast cancer progression

Teresa Gagliano et al. J Clin Invest. .

Abstract

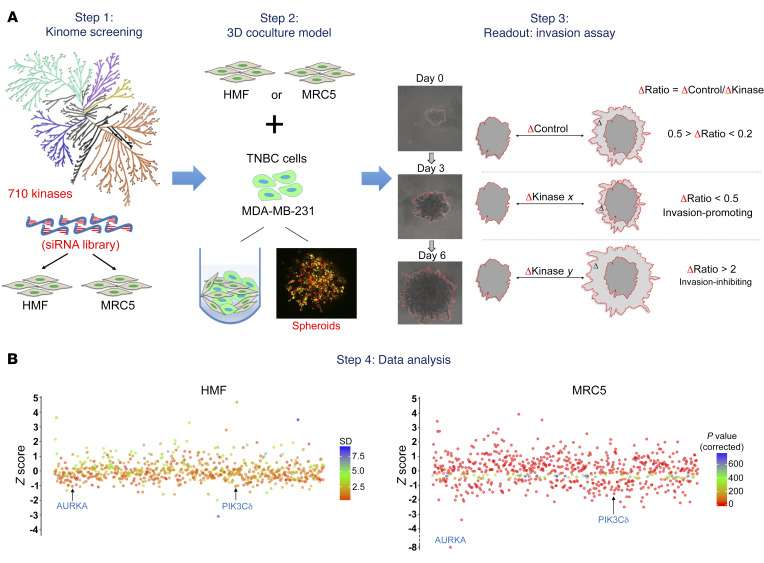
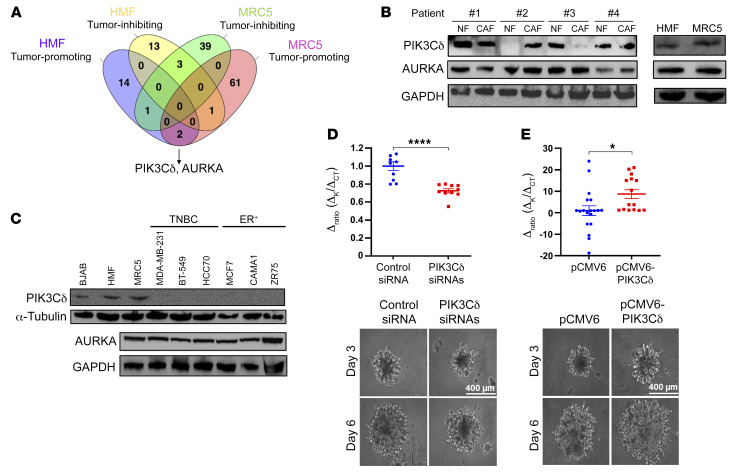
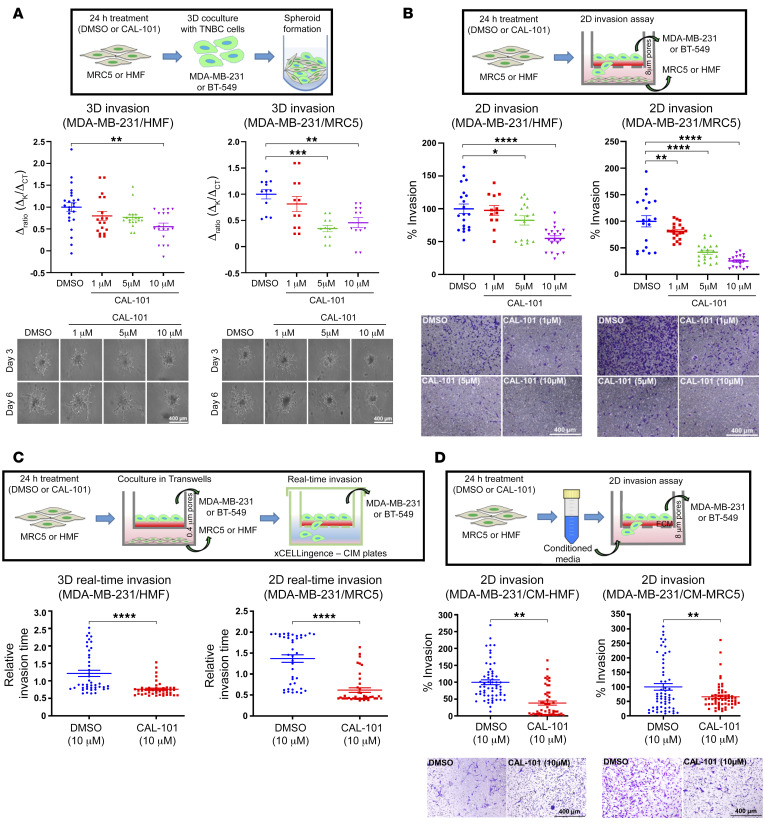
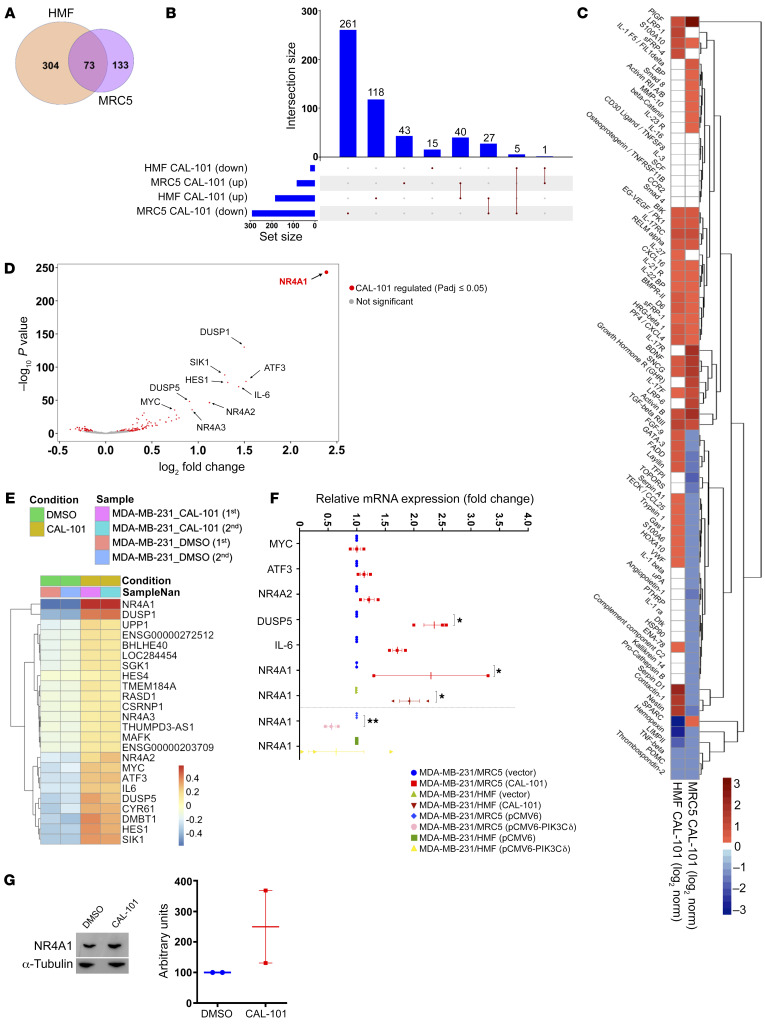
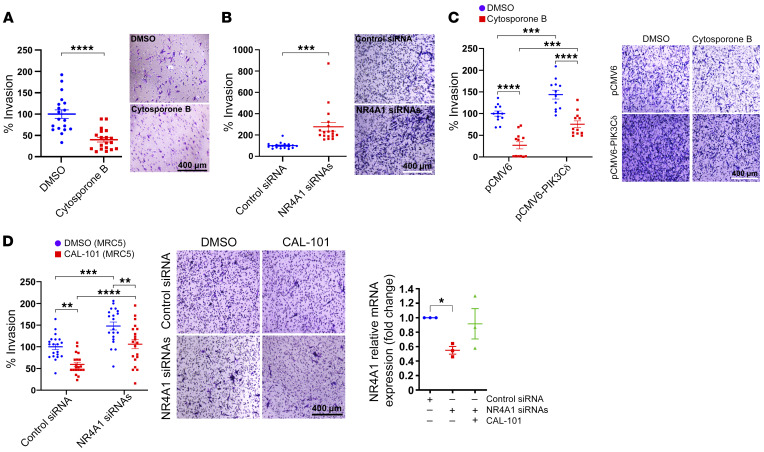
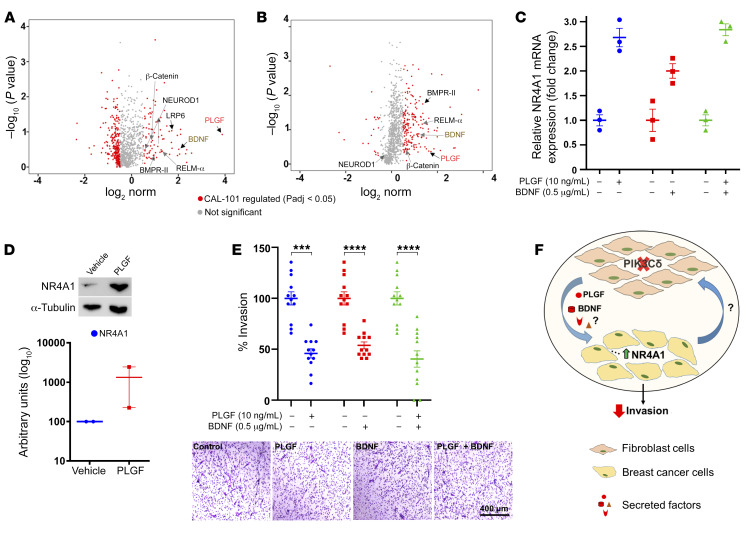
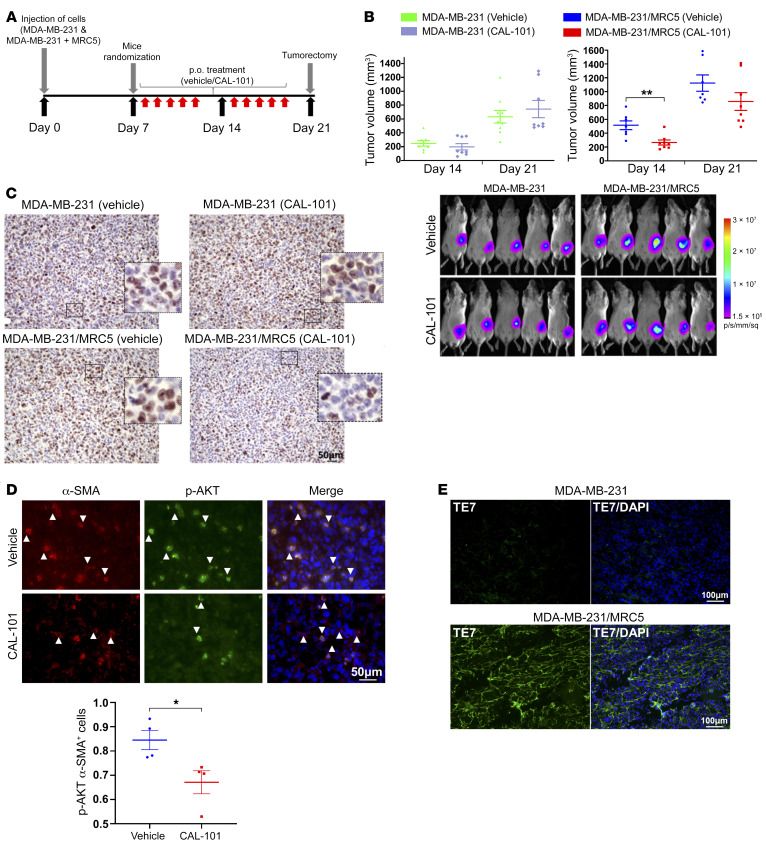
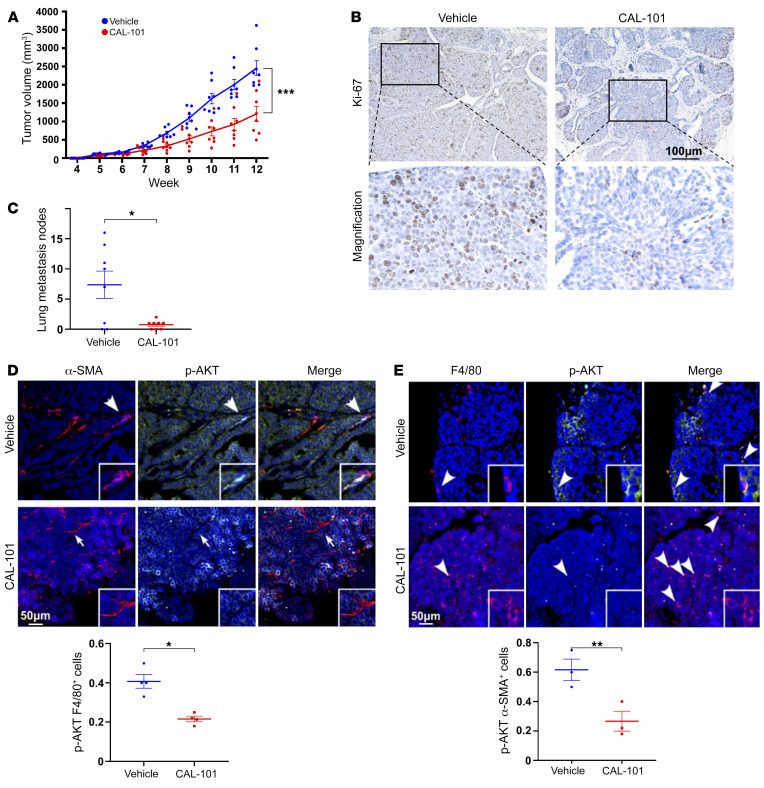
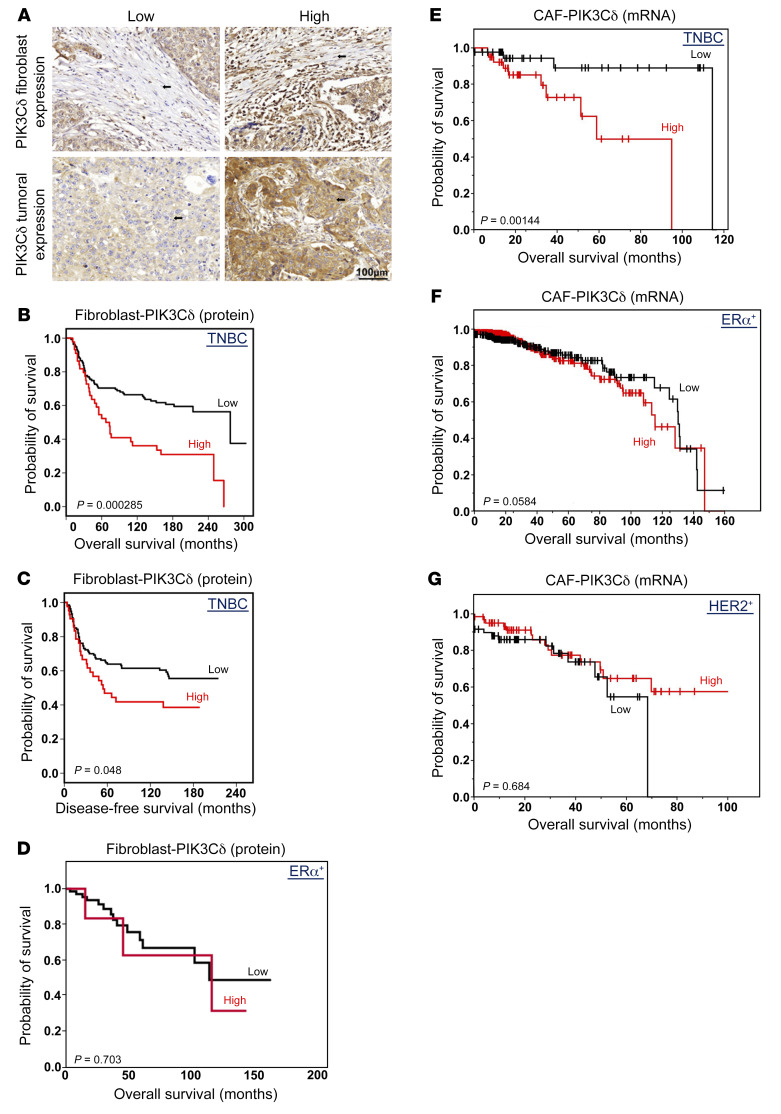
As there is growing evidence for the tumor microenvironment's role in tumorigenesis, we investigated the role of fibroblast-expressed kinases in triple-negative breast cancer (TNBC). Using a high-throughput kinome screen combined with 3D invasion assays, we identified fibroblast-expressed PIK3Cδ (f-PIK3Cδ) as a key regulator of cancer progression. Although PIK3Cδ was expressed in primary fibroblasts derived from TNBC patients, it was barely detectable in breast cancer (BC) cell lines. Genetic and pharmacological gain- and loss-of-function experiments verified the contribution of f-PIK3Cδ in TNBC cell invasion. Integrated secretomics and transcriptomics analyses revealed a paracrine mechanism via which f-PIK3Cδ confers its protumorigenic effects. Inhibition of f-PIK3Cδ promoted the secretion of factors, including PLGF and BDNF, that led to upregulation of NR4A1 in TNBC cells, where it acts as a tumor suppressor. Inhibition of PIK3Cδ in an orthotopic BC mouse model reduced tumor growth only after inoculation with fibroblasts, indicating a role of f-PIK3Cδ in cancer progression. Similar results were observed in the MMTV-PyMT transgenic BC mouse model, along with a decrease in tumor metastasis, emphasizing the potential immune-independent effects of PIK3Cδ inhibition. Finally, analysis of BC patient cohorts and TCGA data sets identified f-PIK3Cδ (protein and mRNA levels) as an independent prognostic factor for overall and disease-free survival, highlighting it as a therapeutic target for TNBC.

Keywords: Breast cancer; Cell Biology; Oncology; Protein kinases; Signal transduction.


Conflict of interest statement

Conflict of interest: JS sits on scientific advisory boards for Celltrion, Singapore Biotech, Vor Biopharma, TLC Biopharmaceuticals, and Benevolent AI; has consulted with Lansdowne Partners, Vitruvian, and Social Impact Capital; and chairs the Board of Directors for BB Biotech Healthcare Trust and Xerion Healthcare.

Figures

Figure 1
Figure 1. Experimental design of siRNA kinome screening and identification of fibroblast-expressed kinases affecting TNBC invasion.
(A) Step 1: Silencing of 710 kinases in HMF and MRC5 cells using a siRNA kinome library. Step 2: 3D coculture of HMF or MRC5 with MDA-MB-231 in the presence of Matrigel and chemoattractants to promote invasion. A representative image of cells stained with different fluorescent lipophilic tracers is shown: MDA-MB-231 (red/DiRDiIC18) and MRC5 (green/DiOC6). Step 3: The invasive potential of MDA-MB-231 cells was used as a readout tool. Results are expressed as changes in spheroid surface between day 6 and day 3 (Δratio = ΔCTK). The Δratio values were used to calculate the Z scores based on the formula Z = (x – μ)/σ, where μ is Δratio mean of 710 kinases, σ is standard deviation (SD), and x is Δratio value for each kinase. For HMF, the Δratio Z score color code refers to SD, as the screening was performed twice, while for MRC5 the Δratio Z score color code refers to P value. (B) Step 4: The Z scores for HMF and MRC5 are shown. Kinases were divided depending on their effects on MDA-MB-231 invasion. Invasion-promoting: Δratio ≤ 0.5, P < 0.01 (as well as SD < 0.5 for HMF). Invasion-inhibiting: Δratio > 2, P > 0.05 (as well as SD > 0.5 for HMF).
Figure 2
Figure 2. Involvement of fibroblast-expressed PIK3Cδ in TNBC invasion.
(A) Venn diagram comparing the number of invasion-promoting and invasion-inhibiting kinases in HMF and MRC5 cells. (B) Western blotting of PIK3Cδ and AURKA in HMF, MRC5, and primary fibroblasts obtained from TNBC patients. GAPDH was used as loading control. (C) Western blotting of PIK3Cδ and AURKA in BC and fibroblast cell lines (BJAB B cell line was used as positive control for PIK3Cδ expression). GAPDH and α-tubulin were used as loading controls. (D) Validation of effects of PIK3Cδ knockdown in MRC5 on MDA-MB-231 invasion following the experimental procedure described above (n = 3 independent experiments, minimum 3 technical replicates). Results are expressed as mean ± SEM. Significance was calculated using unpaired t test; ****P < 0.0001 vs. control siRNA. (E) Effects of PIK3Cδ overexpression in MRC5 cells, using the pCMV6-AC-PIK3Cδ-GFP plasmid, on MDA-MB-231 invasion following the experimental procedure described above (n = 3 independent experiments, minimum 3 technical replicates). Results are expressed as mean ± SEM. Significance was calculated using unpaired t test; *P < 0.05 for control siRNA vs. pCMV6-transfected fibroblasts.
Figure 3
Figure 3. Effects of chemical inhibition of PIK3Cδ on TNBC 2D and 3D invasion.
(A) 3D invasion assay: HMF (left panel) and MRC5 (right panel) cells were pretreated with DMSO or with 1, 5, or 10 μM CAL-101. After 24 hours, fibroblasts were cocultured with MDA-MB-231, and invasion was measured. Representative pictures are shown (n = 3 independent experiments, minimum 4 technical replicates). Significance was calculated using 1-way ANOVA and Tukey’s multiple-comparisons tests. Results are expressed as mean ± SEM; **P < 0.01, ***P < 0.001 vs. DMSO-treated fibroblasts. (B) 2D invasion assay: HMF (left) and MRC5 (right) cells were pretreated with DMSO or with 1, 5, or 10 μM CAL-101 for 24 hours and were seeded on the lower chamber of a Transwell. MDA-MB-231 cells were seeded on the Matrigel-coated upper chamber of the Transwell and cocultured with the fibroblasts. Twenty-four hours later, migrated MDA-MB-231 cells were fixed, stained, and counted (n = 3 independent experiments, minimum 3 technical replicates). Significance was calculated using 1-way ANOVA and Tukey’s multiple-comparisons tests. Data are expressed as mean ± SEM; *P < 0.05, **P < 0.01, ****P < 0.0001 vs. DMSO-treated fibroblasts. (C) Real-time invasion assay: HMF (left) and MRC5 (right) cells were treated as in B. MDA-MB-231 cells were seeded on the upper chamber of the Transwell insert and were cocultured with the fibroblasts. After 24 hours, MDA-MB-231 cells were moved to CIM-Plates (xCELLigence, ACEA Biosciences) to monitor their relative invasion rate t. Significance was calculated using unpaired t test. Results are expressed as mean ± SEM; ****P < 0.0001. (D) Conditioned medium (CM) invasion assay: HMF (left) and MRC5 (right) cells were treated with vehicle or 10 μM CAL-101 in serum-free medium for 24 hours to obtain the CM. MDA-MB-231 cells were incubated with HMF or MRC5 CM for 2D invasion assays (n = 3 independent experiments, minimum 10 technical replicates). Significance was calculated using unpaired t test. Data are expressed as mean ± SEM; **P < 0.01 vs. DMSO-treated fibroblasts’ CM. Scale bars: 400 μm.
Figure 4
Figure 4. Global secretome analysis of CAL-101–treated fibroblasts and transcriptomics analysis of MDA-MB-231 cells.
(A) To obtain CM from HMF and MRC5, cells were treated with vehicle or 10 μM CAL-101 in serum-free medium for 24 hours. CM was used to perform secretome analysis using the Human L1000 Array. Venn diagram showing differences in the secreted proteins significantly regulated by CAL-101 in HMF and MRC5 cells (Padj < 0.05 and log2 fold difference of ≥|0.5|). (B) UpSet plot showing common and unique CAL-101–regulated proteins significantly upregulated (up) or downregulated (down) in each data set (MRC5 and HMF). (C) Heatmap comparing log2 fold change of secreted proteins between CAL-101–treated HMF and MRC5 cells. (D) MRC5 cells were treated with either DMSO or 10 μM CAL-101 for 24 hours. Then cells were washed with PBS to remove the treatment, and complete fresh medium was added to each well. Five-micrometer inserts containing MDA-MB-231 cells were then added in the well containing previously treated MRC5. Twenty-four hours after coculture, cancer cells were collected for RNA extraction and subsequent RNA sequencing. Volcano plot showing the log2 fold change of genes in MDA-MB-231 cells that responded differently to CAL-101 treatment of MRC5 cells (DMSO:CAL-101). The log10 of P value, for significance in fold change, is plotted on the y axis. (E) Heatmap showing amounts by which the read counts of the top 24 regulated genes (ordered based on log2 fold change ≥|0.5| and Padj ≤0.05) deviate from the genes’ average across all the samples. (F) qRT-PCR validation of genes identified via the RNA-seq and DESeq2 analysis. Significance was calculated using unpaired t tests. Results are expressed as mean ± SEM; *P < 0.05, **P < 0.01 vs. vector. (G) Western blotting of NR4A1 in MDA-MB-231 cells following coculture with CAL-101–treated MRC5 cells. α-Tubulin was used as loading control. Densitometry analysis of the blot is displayed as a ratio between CAL-101–treated and DMSO-treated cells.
Figure 5
Figure 5. Effects of fibroblast PIK3Cδ expression on NR4A1-mediated invasion of TNBC cells.
(A) 2D invasion assay: MDA-MB-231 cells were seeded on the Matrigel-coated upper chamber of the Transwell insert and were treated with DMSO or 5 μM cytosporone B. After 24 hours, migrated MDA-MB-231 cells were fixed, stained, and counted (n = 2 independent experiments, minimum 9 technical replicates). Significance was calculated using unpaired t test. Results are expressed as mean SEM; ****P < 0.0001 vs. DMSO-treated cells. (B) 2D invasion assay: MDA-MB-231 cells transfected with control or NR4A1 siRNAs were seeded as above. After 24 hours, migrated MDA-MB-231 cells were fixed, stained, and counted (n = 2 independent experiments, minimum 9 technical replicates). Significance was calculated using unpaired t test. Results are expressed as mean ± SEM; ***P < 0.001 vs. siRNA control–transfected cells. (C) Effects of PIK3Cδ overexpression in MRC5 on MDA-MB-231 invasion following pretreatment of MDA-MB-231 with 5 μM cytosporone B (n = 2 independent experiments, minimum 9 technical replicates). Significance was calculated using 2-way ANOVA and Tukey’s multiple-comparisons tests. Results are expressed as mean ± SEM; ***P < 0.001, ****P < 0.0001 vs. the samples indicated in the graph. (D) Left and middle: MRC5 cells were treated with CAL-101 or DMSO. NR4A1 siRNA MDA-MB-231 or control siRNA cells were seeded on the Matrigel-coated upper chamber of a Transwell and cocultured with fibroblasts. After 24 hours, migrated MDA-MB-231 cells were fixed, stained, and counted (n = 3 independent experiments, minimum 6 technical replicates). Significance was calculated using 2-way ANOVA and Tukey’s multiple-comparisons tests. Results are expressed as mean ± SEM; **P < 0.01, ***P < 0.001, ****P < 0.0001 vs. the samples indicated in the graph. Right: NR4A1 levels were evaluated in siRNA-transfected MDA-MB-231 cells before and after coculture with CAL-101–treated MRC5. Significance was calculated using 1-way ANOVA followed by Dunnett’s tests. Results are expressed as mean ± SEM; *P < 0.05 vs. control. Scale bars: 400 μm.
Figure 6
Figure 6. Effects of secreted factors including PLGF and BDNF on NR4A1-mediated invasion of TNBC cells.
(A) Volcano plot showing the log2 fold change of secreted proteins in MRC5 cells that responded differentially to the CAL-101 treatment. The log10 of P value, for significance in fold change, is plotted on the y axis. (B) Volcano plot showing the log2 fold change of secreted proteins in HMF cells that responded differentially to the CAL-101 treatment. The log10 of P value, for significance in fold change, is plotted on the y axis. (C) qRT-PCR of NR4A1 expression levels in MDA-MB-231 cells following treatment with PLGF and BDNF. (D) Western blotting of NR4A1 in MDA-MB-231 cells following treatment with PLGF (10 ng/mL). GAPDH was used as loading control. Densitometry analysis of the blot is displayed as a ratio between PLGF-treated and vehicle-treated cells. (E) 2D invasion assay: MDA-MB-231 cells were seeded on the Matrigel-coated upper chamber of the Transwell insert and were treated with PLGF or BDNF or vehicle. After 24 hours, migrated MDA-MB-231 cells were fixed, stained, and counted (n = 3 independent experiments, minimum 4 technical replicates). Significance was calculated using unpaired t test. Results are expressed as mean ± SEM; ***P < 0.001, ****P < 0.0001 vs. vehicle-treated cells. (F) Schematic model depicting the paracrine signaling pathway between fibroblasts and TNBC cells. Inhibition of PIK3Cδ in fibroblasts leads to the secretion of different factors, including PLGF and BDNF, which promote the overexpression of NR4A1 in epithelial cancer cells. NR4A1 acts as a tumor suppressor inhibiting the invasiveness of TNBC cells.
Figure 7
Figure 7. Effects of fibroblast PIK3Cδ inhibition on TNBC tumor growth in vivo.
(A) Schematic representation of the in vivo experiment using NOD CB17 PRKDC/J mice. MDA-MB-231 (groups 1 and 2) and MDA-MB-231/MRC5 (groups 3 and 4) tumor cells were implanted s.c. on day 0. After randomization on day 7, treatment with CAL-101 was initiated in groups 2 and 4, whereas groups 1 and 3 were given vehicle. During the course of the study, the growth of the subcutaneously implanted primary tumors was determined twice weekly by luminescence and caliper measurement. (B) Top: Box-and-whisker plots comparing different groups at day 14 and day 21. Significance was calculated using unpaired t test. Results are expressed as mean SEM; **P < 0.01. Bottom: Representative in vivo images of different groups, treated with vehicle or CAL-101. (C) Histological analysis of Ki-67 expression in representative tumor tissue sections of different groups. Original magnification, ×20. (D) Representative images of immunofluorescent staining of MDA-MB-231/MRC5 tumor cryosections for α-SMA and p-AKTSer473 after DMSO or CAL-101 treatment. Significance was calculated using unpaired t test. Results are expressed as mean ± SEM; *P < 0.05 vs. vehicle-treated tumors. Original magnification, ×40. (E) Representative images of immunofluorescence staining of tumor cryosections using TE-7 anti–human fibroblast antibody. Original magnification, ×20.
Figure 8
Figure 8. Effects of CAL-101 treatment on tumor growth of MMTV-PyMT transgenic mice.
(A) Tumor volumes from MMTV-PyMT transgenic mice after vehicle or CAL-101 treatment (n = 8 mice per group). Individual values for each mouse are displayed. Significance was calculated using unpaired t test (week 12). Results are expressed as mean ± SEM; ***P < 0.001. (B) Representative images of IHC Ki-67 staining in the mammary tumor sections of MMTV-PyMT transgenic mice after vehicle or CAL-101 treatment. (C) Quantification of lung metastatic nodules in each group. Significance was calculated using unpaired t test. Results are expressed as mean ± SEM; *P < 0.05. Yellow and black dots represent mice that were sacrificed at week 12 or week 15 respectively. (D) Top: Representative images of immunofluorescent staining for α-SMA and p-AKTThr308 in the mammary tumor sections of MMTV-PyMT transgenic mice after vehicle or CAL-101 treatment. Arrows indicate α-SMA+ fibroblasts. Higher-magnification images are shown in the bottom right corners. Bottom: Quantification of p-AKTThr308 immunofluorescent staining in tumor-infiltrating α-SMA+ fibroblasts in the mammary tumors of MMTV-PyMT transgenic mice after vehicle or CAL-101 treatment. Significance was calculated using multiple t tests. Results are expressed as mean ± SEM; *P < 0.05 vs. vehicle-treated tumors. (E) Top: Representative images of immunofluorescent staining for F4/80 and pAKTThr308 in the mammary tumor sections of MMTV-PyMT transgenic mice after vehicle or CAL-101 treatment. Arrows indicate F4/80+ macrophages. Higher-magnification images are shown in the bottom right corners. Bottom: Quantification of pAKTThr308 immunofluorescent staining in tumor-infiltrating F4/80+ macrophages in the mammary tumors of MMTV-PyMT transgenic mice after vehicle or CAL-101 treatment. Significance was calculated using multiple t tests. Results are expressed as mean ± SEM; **P < 0.01 vs. vehicle-treated tumors.
Figure 9
Figure 9. PIK3Cδ expression in fibroblast cells and association with patient survival.
(A) Representative images of low and high PIK3Cδ expression in tumor or surrounding fibroblast cells (α-SMA+). Original magnification, ×20. (B) Kaplan-Meier plots showing the association between fibroblast PIK3Cδ protein expression and OS (log-rank test; P = 0.000285) in TNBC patients. (C) Kaplan-Meier plots showing the association between fibroblast PIK3Cδ protein expression and DFS (log-rank test; P = 0.048) in TNBC patients. (D) Kaplan-Meier plots showing the association between fibroblast PIK3Cδ protein expression and OS (log-rank test; P = 0.703) in ERα+ patients. (E) Kaplan-Meier plots showing the association between CAF-PIK3Cδ mRNA expression and OS (log-rank test; P = 0.001) in TNBC patients following deconvolution of bulk TCGA RNA-Seq samples. (F) Kaplan-Meier plots showing the association between CAF-PIK3Cδ mRNA expression and OS (log-rank test; P = 0.058) in ERα+ patients following deconvolution of bulk TCGA RNA-Seq samples. (G) Kaplan-Meier plots showing the association between CAF-PIK3Cδ mRNA expression and OS (log-rank test; P = 0.684) in HER2+ patients following deconvolution of bulk TCGA RNA-Seq samples.

References

    1. Bauer KR, Brown M, Cress RD, Parise CA, Caggiano V. Descriptive analysis of estrogen receptor (ER)-negative, progesterone receptor (PR)-negative, and HER2-negative invasive breast cancer, the so-called triple-negative phenotype: a population-based study from the California cancer Registry. Cancer. 2007;109(9):1721–1728. doi: 10.1002/cncr.22618. - DOI - PubMed
    1. Perou CM, et al. Molecular portraits of human breast tumours. Nature. 2000;406(6797):747–752. doi: 10.1038/35021093. - DOI - PubMed
    1. Joyce JA, Pollard JW. Microenvironmental regulation of metastasis. Nat Rev Cancer. 2009;9(4):239–252. doi: 10.1038/nrc2618. - DOI - PMC - PubMed
    1. Kalluri R, Zeisberg M. Fibroblasts in cancer. Nat Rev Cancer. 2006;6(5):392–401. doi: 10.1038/nrc1877. - DOI - PubMed
    1. Quail DF, Joyce JA. Microenvironmental regulation of tumor progression and metastasis. Nat Med. 2013;19(11):1423–1437. doi: 10.1038/nm.3394. - DOI - PMC - PubMed

Publication types

MeSH terms

Substances