. 2020 Mar 26;5(6):e132334.
doi: 10.1172/jci.insight.132334.

MicroRNA-146a regulates immune-related adverse events caused by immune checkpoint inhibitors

Affiliations

MicroRNA-146a regulates immune-related adverse events caused by immune checkpoint inhibitors

Dominik Marschner et al. JCI Insight. .

Abstract

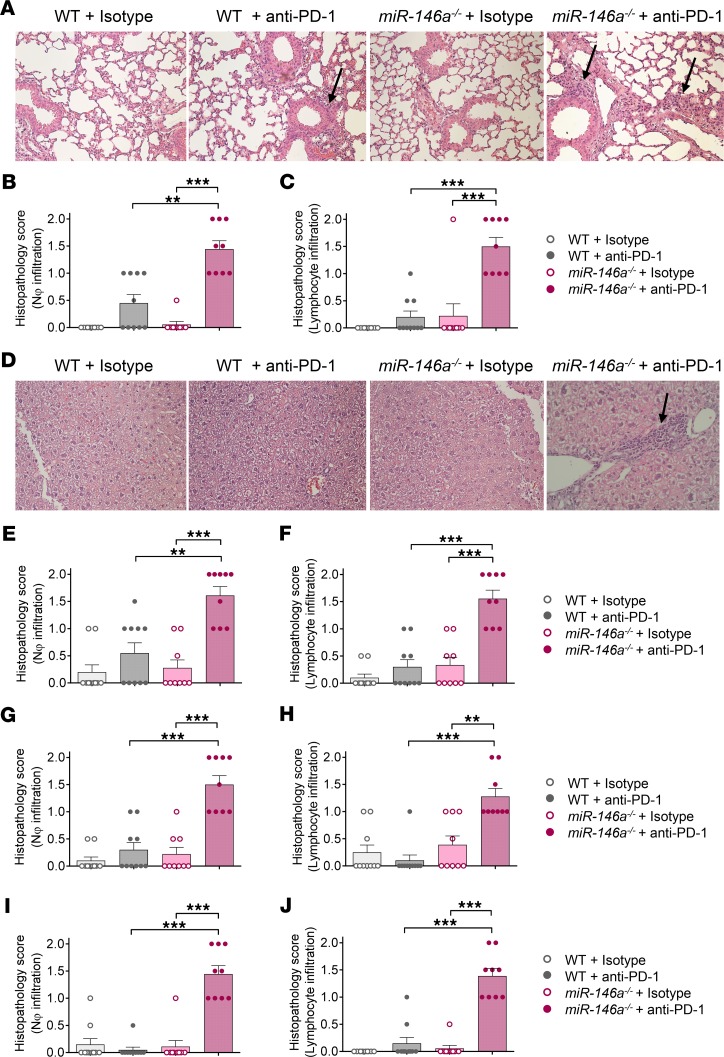
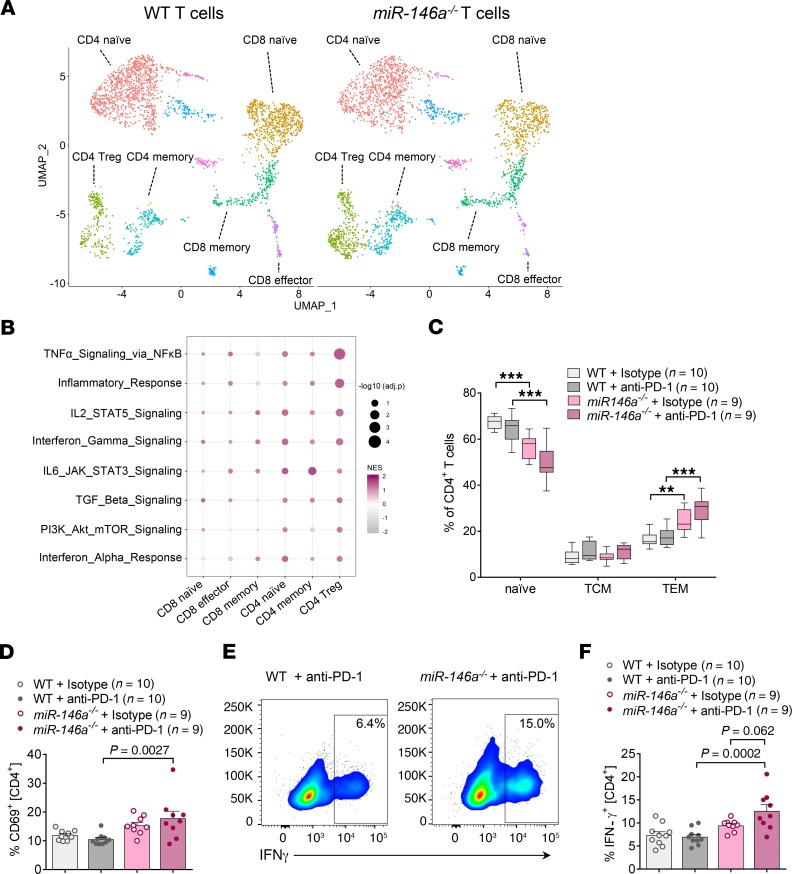
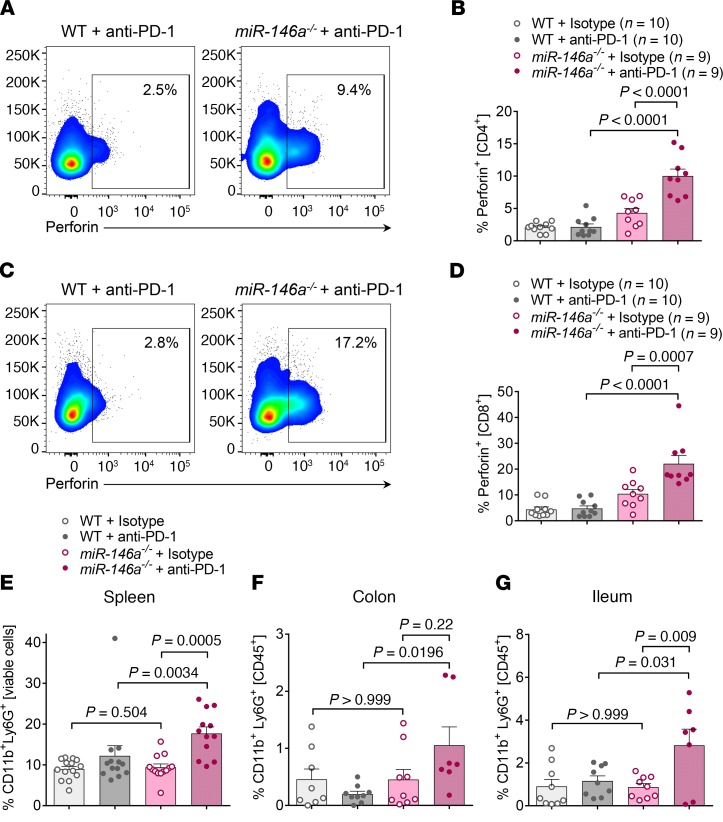
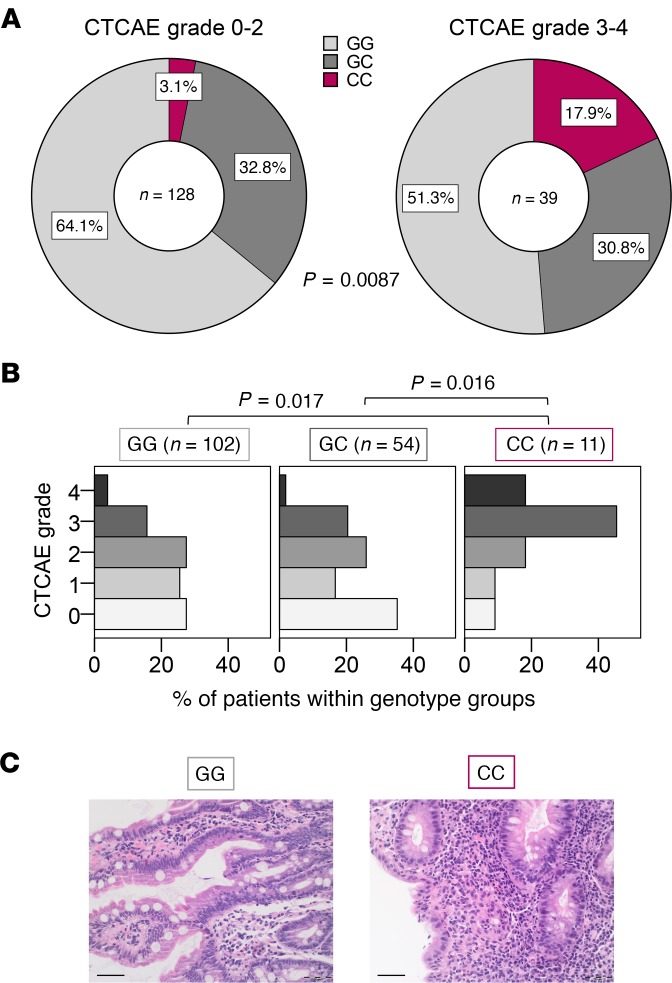
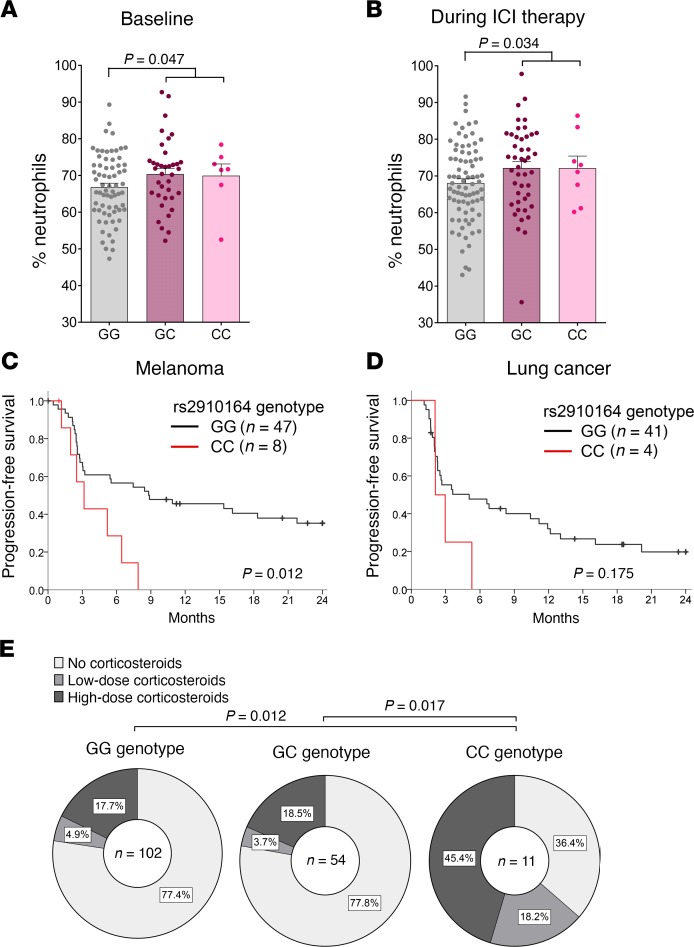
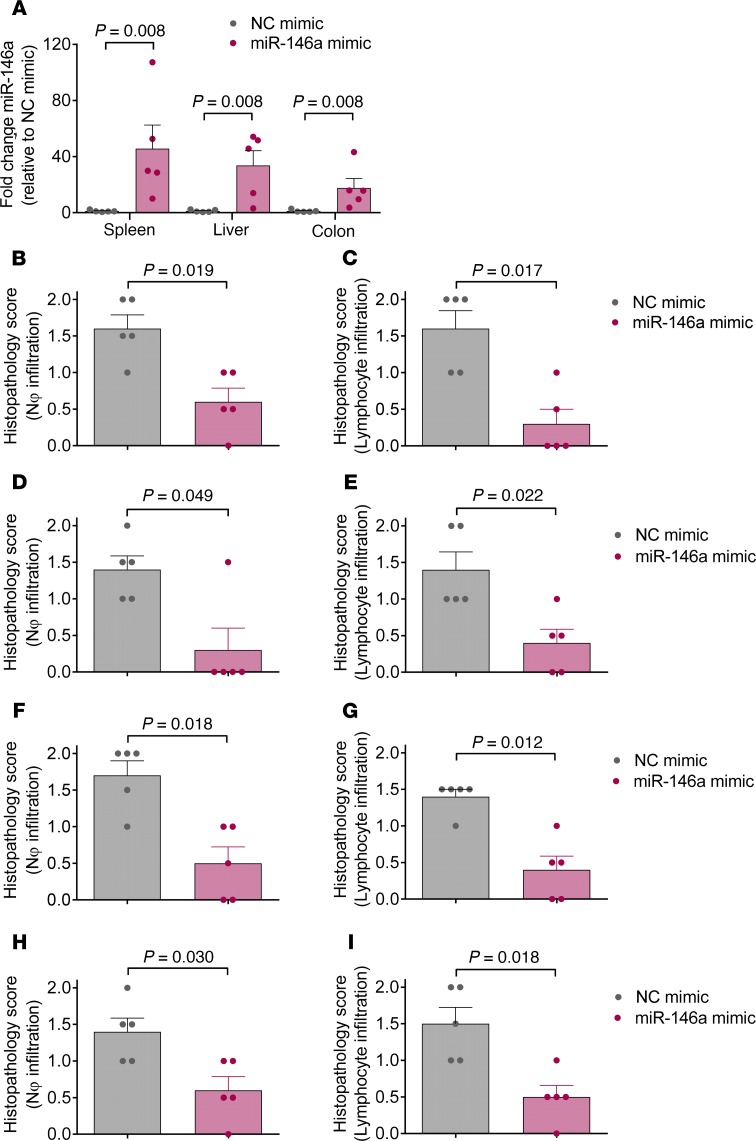
Immune checkpoint inhibitor (ICI) therapy has shown a significant benefit in the treatment of a variety of cancer entities. However, immune-related adverse events (irAEs) occur frequently and can lead to ICI treatment termination. MicroRNA-146a (miR-146a) has regulatory functions in immune cells. We observed that mice lacking miR-146a developed markedly more severe irAEs compared with WT mice in several irAE target organs in 2 different murine models. miR-146a-/- mice exhibited increased T cell activation and effector function upon ICI treatment. Moreover, neutrophil numbers in the spleen and the inflamed intestine were highly increased in ICI-treated miR-146a-/- mice. Therapeutic administration of a miR-146a mimic reduced irAE severity. To validate our preclinical findings in patients, we analyzed the effect of a SNP in the MIR146A gene on irAE severity in 167 patients treated with ICIs. We found that the SNP rs2910164 leading to reduced miR-146a expression was associated with an increased risk of developing severe irAEs, reduced progression-free survival, and increased neutrophil counts both at baseline and during ICI therapy. In conclusion, we characterized miR-146a as a molecular target for preventing ICI-mediated autoimmune dysregulation. Furthermore, we identified the MIR146A SNP rs2910164 as a biomarker to predict severe irAE development in ICI-treated patients.

Keywords: Adaptive immunity; Cancer immunotherapy; Inflammation; Noncoding RNAs; Oncology.


Conflict of interest statement

Conflict of interest: The authors have declared that no conflict of interest exists.

Figures

Figure 1
Figure 1. miR-146a deficiency increases irAE severity in anti–PD-1–treated mice.
WT or miR-146a–/– mice (n = 9–10 per group) were treated with LPS and anti–PD-1/isotype control antibody for 3 weeks as described. The lungs, liver, colon, and skin were isolated on day 22 after the first treatment for histopathological assessment. irAE grading was performed by an experienced pathologist blinded to the treatment groups. 0 = absent, 1 = mild, 2 = massive neutrophil/lymphocyte infiltration. Data were pooled from 2 independent experiments. Statistical significance was analyzed by Kruskal-Wallis test followed by 2-stage linear step-up procedure of Benjamini, Krieger and Yekutieli. Adjusted P value is depicted: **P < 0.01, ***P < 0.001. (A) Representative H&E staining of lung sections at original magnification ×200. Black arrows point towards inflammatory infiltrates. (B and C) Histopathology scores for neutrophil infiltration and lymphocyte infiltration into the lung. (D) Representative H&E staining of liver sections at original magnification ×200. Black arrows point towards inflammatory infiltrates. (E and F) Histopathology scores for neutrophil infiltration and lymphocyte infiltration into the liver. (G and H) Histopathology scores for neutrophil infiltration and lymphocyte infiltration into the colon. (I and J) Histopathology scores for neutrophil infiltration and lymphocyte infiltration into the skin. miR-146a, microRNA-146a, irAE, immune-related adverse event, PD-1, programmed cell death protein-1.
Figure 2
Figure 2. Increased immune activation signature in miR-146a–deficient CD4 T cells of irAE mice.
(A and B) WT or miR-146a–/– mice (n = 2 per group) were treated with low-dose LPS and anti–PD-1/isotype control antibody for 3 weeks before capturing of MACS purified splenic T cells for scRNA-seq using 10× v3.1 Next GEM chemistry. Data were processed, visualized, and analyzed using the Seurat pipeline v3.0 (45, 46). (A) Uniform Manifold Approximation and Projection (UMAP) plots showing distinct T cell clusters in both miR-146a–/– and WT mice. (B) Gene set enrichment analysis of major T cell clusters. Bivariate heatmap depicts normalized enrichment score as color code and –log10 of the adjusted P value as dot size. Hallmark gene sets were derived from MSigDB. (C and D) WT or miR-146a–/– mice (n = 9–10 per group) were treated with LPS and anti–PD-1/isotype control antibody as indicated. Spleens were isolated on day 22 and CD4+ T cells analyzed by flow cytometry to differentiate naive T cells (CD44CD62L+), central memory T cells (TCM, CD44+CD62L+, effector memory T cells (TEM, CD44+CD62L), and activated T cells (CD69+). ***P < 0.001 by 1-way ANOVA followed by Tukey’s post hoc test. Box-and-whisker plot (C) depicts the 25th and the 75th percentiles as the bounds of the boxes, the median as the line within the box, and minimum to maximum as the whiskers. (D) Representative flow cytometry plots showing intracellular IFN-γ staining gated on CD4+ T cells. (E and F) WT or miR-146a–/– mice (n = 9–10 per group) were treated with LPS and anti–PD-1/isotype control antibody as indicated. Splenic CD4+ T cells were assessed by flow cytometry on day 22. (E) Pooled data from 2 independent in vivo experiments. Statistical significance was analyzed by 1-way ANOVA followed by Tukey’s post hoc test. miR-146a, microRNA-146a, irAE, immune-related adverse event, PD-1, programmed cell death protein-1, scRNA-seq, single cell RNA sequencing.
Figure 3
Figure 3. T cell effector function and neutrophil recruitment are regulated by miR-146a during irAE development.
(AD) WT or miR-146a–/– mice (n = 9–10 per group) were treated with LPS and anti–PD-1/isotype control antibody as indicated and splenocytes assessed by flow cytometry on day 22. Statistical significance was analyzed by 1-way ANOVA followed by Tukey’s post hoc test. (A) Representative flow cytometry plots showing intracellular perforin staining gated on CD4+ T cells. (B) Pooled data from 2 independent in vivo experiments. (C) Representative flow cytometry plots showing intracellular perforin staining gated on CD8+ T cells. (D) Pooled data from 2 independent in vivo experiments. (E) Pooled spleen cell data from 3 independent experiments (n = 12–14 per group). Statistical significance was analyzed by Kruskal-Wallis test followed by 2-stage linear step-up procedure of Benjamini, Krieger, and Yekutieli. (F and G) WT or miR-146a–/– mice (n = 7–9 per group) were treated with LPS and anti–PD-1/isotype control antibody as indicated. Colon and ileum were isolated and digested on day 22. CD11b+Ly6G+ neutrophils were analyzed by flow cytometry. Data were from 2 independent experiments. Statistical significance was analyzed by 1-way ANOVA followed by Tukey’s post hoc test. miR-146a, microRNA-146a, irAE, immune-related adverse event, PD-1, programmed cell death protein-1.
Figure 4
Figure 4. SNP rs2910164 in the MIR146A gene is associated with increased irAE severity in patients.
Genotype of the SNP rs2910164 in the MIR146A gene was determined from 167 patients with cancer treated with ≥3 cycles anti–PD-1 or anti–PD-L1 therapy. irAEs were graded according to the Common Terminology Criteria for Adverse Events (CTCAE). (A) Genotype frequencies for the group of patients who developed no/mild irAEs (CTCAE grades 0–2) or severe irAEs (CTCAE grades 3–4), respectively, are shown. Fisher’s exact test was used to analyze the contingency table. (B) Percentage of patients with CTCAE grades 0–4 irAEs in the different genotype groups is shown. Data were statistically analyzed by Kruskal-Wallis test followed by post hoc pairwise comparison Dunn’s test and P values were adjusted by Bonferroni’s correction. (C) Exemplary colon histopathology pictures of a GG patient with grade 1 intestinal irAEs (left) and of a CC patient with grade 4 intestinal irAEs (right) are shown. Scale bar: 50 μm. irAE, immune-related adverse event, PD-1, programmed cell death protein-1.
Figure 5
Figure 5. Patients with the MIR146A SNP rs2910164 display increased neutrophil numbers and reduced survival.
(A and B) Patient charts of patients treated with immune checkpoint inhibitors (ICIs) were retrospectively analyzed for neutrophil counts before ICI treatment (A) and during ICI treatment (B), where available. Percentage of neutrophils of total leukocyte count is depicted for patients with the rs2910164 GG, GC, and CC genotype, respectively. Data were analyzed by 2-tailed unpaired Student’s t test. (C and D) Progression-free survival of patients with melanoma (C) and patients with lung cancer (D) according to their rs2910164 genotype is shown. Data were analyzed by log-rank (Mantel-Cox) test. (E) Corticosteroid dose due to inflammatory side effects in the different rs2910164 genotype groups is depicted. Low-dose corticosteroids, <1 mg/kg/d prednisone or equivalent. High-dose corticosteroids, ≥ 1 mg/kg/d. Data were analyzed by Kruskal-Wallis test followed by Dunn-Bonferroni’s post hoc test.
Figure 6
Figure 6. Treatment with a miR-146a specific mimic reduces irAE severity in anti–PD-1–treated mice.
WT C75BL/6 mice (n = 5 per group) were treated with LPS and 250 μg of anti–PD-1 antibody for 3 weeks as described. Additionally, mice were treated i.p. with negative control (NC) mimic or miR-146a mimic in in vivo-jetPEI on days 5, 9, 13, 17, and 21. (A) Expression of miR-146a in the spleen, liver, and colon was analyzed by qRT-PCR on day 22. (BI) The lungs, liver, colon, and skin were isolated on day 22 for histopathological assessment and irAE grading by an experienced pathologist. Histopathology scores for neutrophil infiltration and lymphocyte infiltration into the lung (B and C), liver (D and E), colon (F and G), and skin (H and I) are shown. 0 = absent, 1 = mild, 2 = massive neutrophil/lymphocyte infiltration. Data were statistically analyzed by Mann Whitney U test. miR-146a, microRNA-146a, irAE, immune-related adverse event, PD-1, programmed cell death protein-1.

References

    1. Johnson DB, Chandra S, Sosman JA. Immune checkpoint inhibitor toxicity in 2018. JAMA. 2018;320(16):1702–1703. doi: 10.1001/jama.2018.13995. - DOI - PubMed
    1. Hodi FS, et al. Improved survival with ipilimumab in patients with metastatic melanoma. N Engl J Med. 2010;363(8):711–723. doi: 10.1056/NEJMoa1003466. - DOI - PMC - PubMed
    1. Topalian SL, et al. Safety, activity, and immune correlates of anti-PD-1 antibody in cancer. N Engl J Med. 2012;366(26):2443–2454. doi: 10.1056/NEJMoa1200690. - DOI - PMC - PubMed
    1. Brahmer JR, et al. Safety and activity of anti-PD-L1 antibody in patients with advanced cancer. N Engl J Med. 2012;366(26):2455–2465. doi: 10.1056/NEJMoa1200694. - DOI - PMC - PubMed
    1. Postow MA, Sidlow R, Hellmann MD. Immune-related adverse events associated with immune checkpoint blockade. N Engl J Med. 2018;378(2):158–168. doi: 10.1056/NEJMra1703481. - DOI - PubMed

Publication types