

Profitability of Large Pharmaceutical Companies Compared With Other Large Public Companies
- PMID: 32125401
- PMCID: PMC7054843
- DOI: 10.1001/jama.2020.0442
Profitability of Large Pharmaceutical Companies Compared With Other Large Public Companies
Abstract
Importance: Understanding the profitability of pharmaceutical companies is essential to formulating evidence-based policies to reduce drug costs while maintaining the industry's ability to innovate and provide essential medicines.
Objective: To compare the profitability of large pharmaceutical companies with other large companies.
Design, setting, and participants: This cross-sectional study compared the annual profits of 35 large pharmaceutical companies with 357 companies in the S&P 500 Index from 2000 to 2018 using information from annual financial reports. A statistically significant differential profit margin favoring pharmaceutical companies was evidence of greater profitability.
Exposures: Large pharmaceutical vs nonpharmaceutical companies.
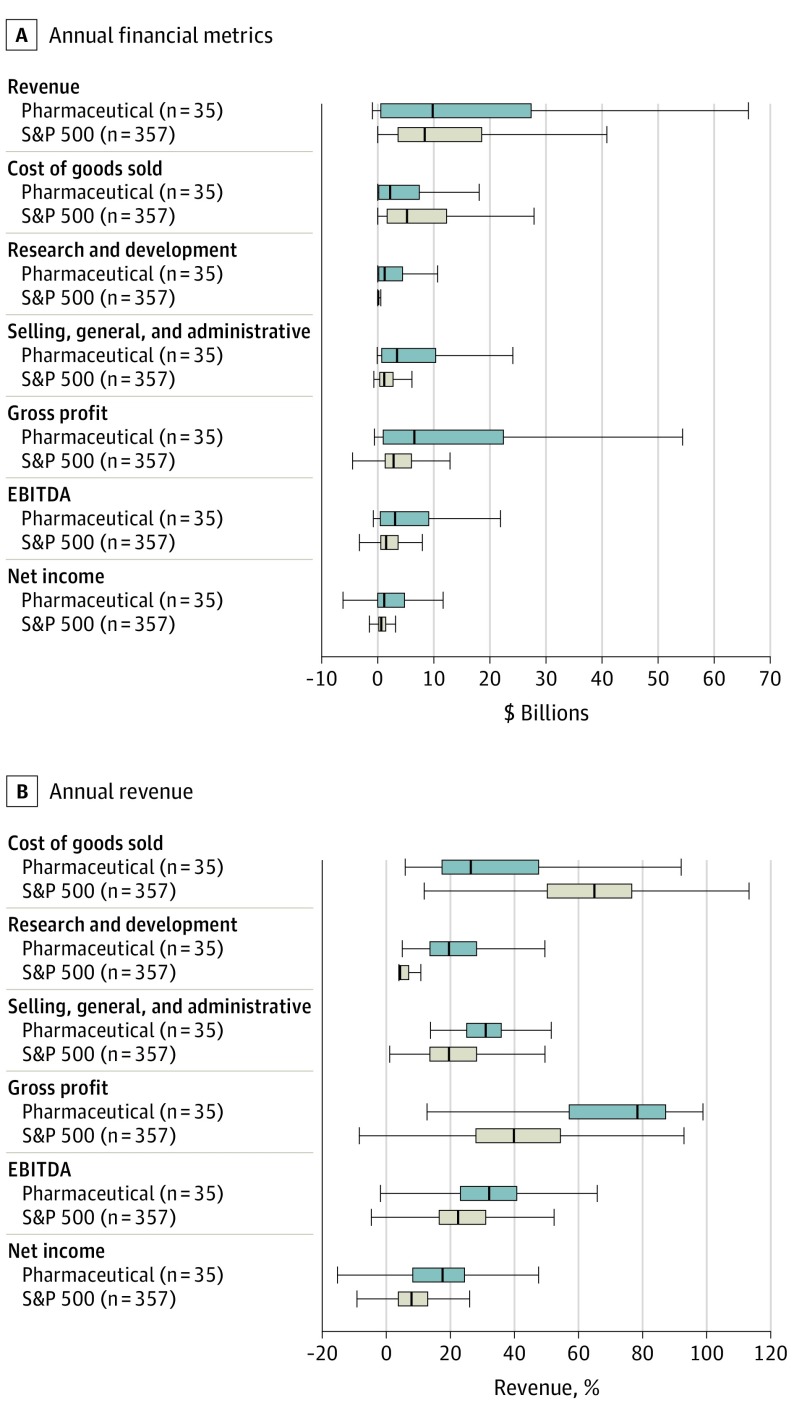
Main outcomes and measures: The main outcomes were revenue and 3 measures of annual profit: gross profit (revenue minus the cost of goods sold); earnings before interest, taxes, depreciation, and amortization (EBITDA; pretax profit from core business activities); and net income, also referred to as earnings (difference between all revenues and expenses). Profit measures are described as cumulative for all companies from 2000 to 2018 or annual profit as a fraction of revenue (margin).
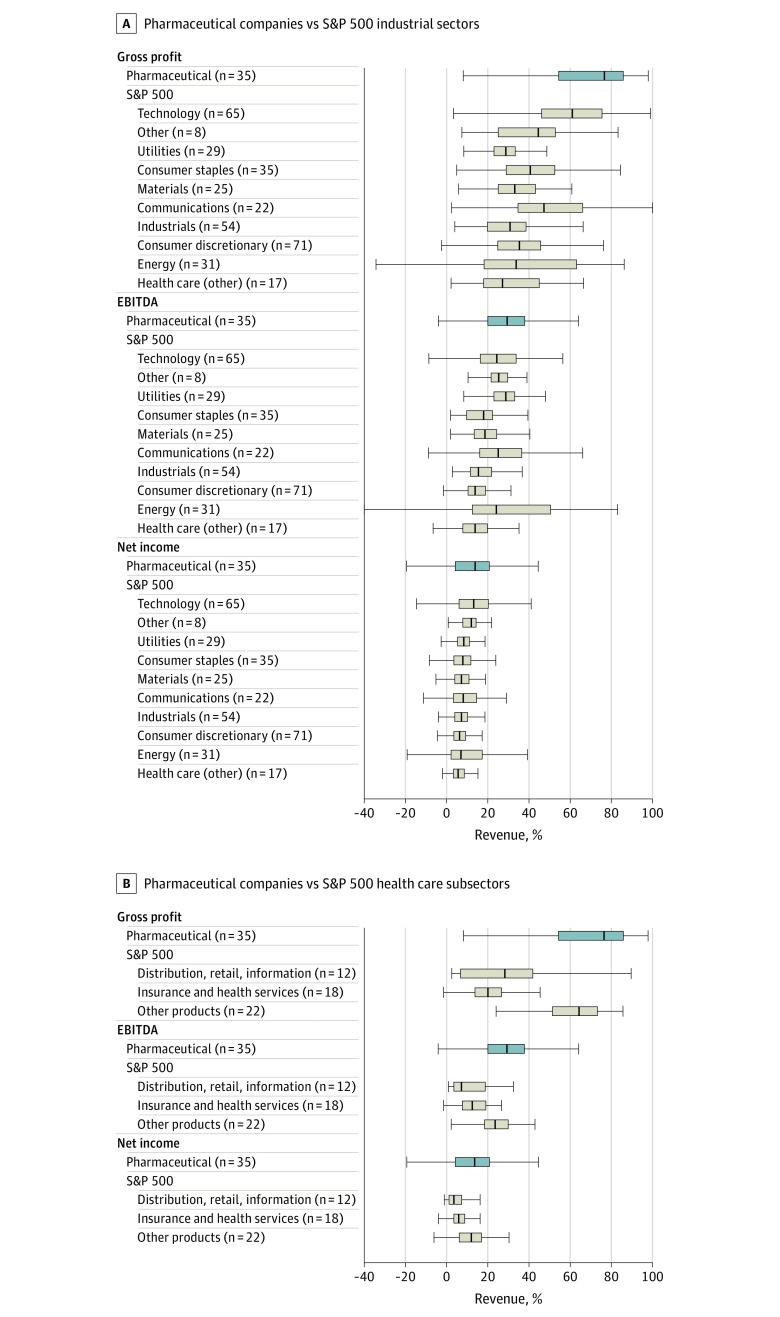
Results: From 2000 to 2018, 35 large pharmaceutical companies reported cumulative revenue of $11.5 trillion, gross profit of $8.6 trillion, EBITDA of $3.7 trillion, and net income of $1.9 trillion, while 357 S&P 500 companies reported cumulative revenue of $130.5 trillion, gross profit of $42.1 trillion, EBITDA of $22.8 trillion, and net income of $9.4 trillion. In bivariable regression models, the median annual profit margins of pharmaceutical companies were significantly greater than those of S&P 500 companies (gross profit margin: 76.5% vs 37.4%; difference, 39.1% [95% CI, 32.5%-45.7%]; P < .001; EBITDA margin: 29.4% vs 19%; difference, 10.4% [95% CI, 7.1%-13.7%]; P < .001; net income margin: 13.8% vs 7.7%; difference, 6.1% [95% CI, 2.5%-9.7%]; P < .001). The differences were smaller in regression models controlling for company size and year and when considering only companies reporting research and development expense (gross profit margin: difference, 30.5% [95% CI, 20.9%-40.1%]; P < .001; EBITDA margin: difference, 9.2% [95% CI, 5.2%-13.2%]; P < .001; net income margin: difference, 3.6% [95% CI, 0.011%-7.2%]; P = .05).
Conclusions and relevance: From 2000 to 2018, the profitability of large pharmaceutical companies was significantly greater than other large, public companies, but the difference was less pronounced when considering company size, year, or research and development expense. Data on the profitability of large pharmaceutical companies may be relevant to formulating evidence-based policies to make medicines more affordable.
Conflict of interest statement
Figures
Comment in
-
Affording Medicines for Today's Patients and Sustaining Innovation for Tomorrow.JAMA. 2020 Mar 3;323(9):831-833. doi: 10.1001/jama.2020.0167. JAMA. 2020. PMID: 32125383 No abstract available.
-
Are Pharmaceutical Companies Earning Too Much?JAMA. 2020 Mar 3;323(9):829-830. doi: 10.1001/jama.2020.0351. JAMA. 2020. PMID: 32125384 No abstract available.
References
-
- National Academies of Sciences, Engineering, and Medicine. Making Medicines Affordable: a National Imperative. Washington, DC: National Academies Press; 2018. - PubMed
-
- Skyrocketing drug prices: year one of the Trump Administration [press release]. Washington, DC: Committee on Oversight and Government Reform ; May 11, 2018.
-
- Sachs R. Prescription drug policy: the year in review, and the year ahead. Health Affairs Blog website. https://www.healthaffairs.org/do/10.1377/hblog20190103.183538/full/. Published January 3, 2019. Accessed January 10, 2019. - DOI
-
- United States Government Accountability Office Drug Industry: Profits, Research and Development Spending, and Merger and Acquisition Deals. Washington, DC: United States Government Accountability Office; 2017. https://www.gao.gov/assets/690/688472.pdf. Accessed June 13, 2018.
