

Estimated Research and Development Investment Needed to Bring a New Medicine to Market, 2009-2018
- PMID: 32125404
- PMCID: PMC7054832
- DOI: 10.1001/jama.2020.1166
Estimated Research and Development Investment Needed to Bring a New Medicine to Market, 2009-2018
Erratum in
-
Errors in Source Data for Study of Drug Development Costs.JAMA. 2022 Sep 20;328(11):1110. doi: 10.1001/jama.2022.14317. JAMA. 2022. PMID: 36125476 No abstract available.
-
Error in Data in Study of Estimated Cost of Bringing a Drug to Market.JAMA. 2022 Sep 20;328(11):1111. doi: 10.1001/jama.2022.14733. JAMA. 2022. PMID: 36125490 Free PMC article. No abstract available.
Abstract
Importance: The mean cost of developing a new drug has been the subject of debate, with recent estimates ranging from $314 million to $2.8 billion.
Objective: To estimate the research and development investment required to bring a new therapeutic agent to market, using publicly available data.
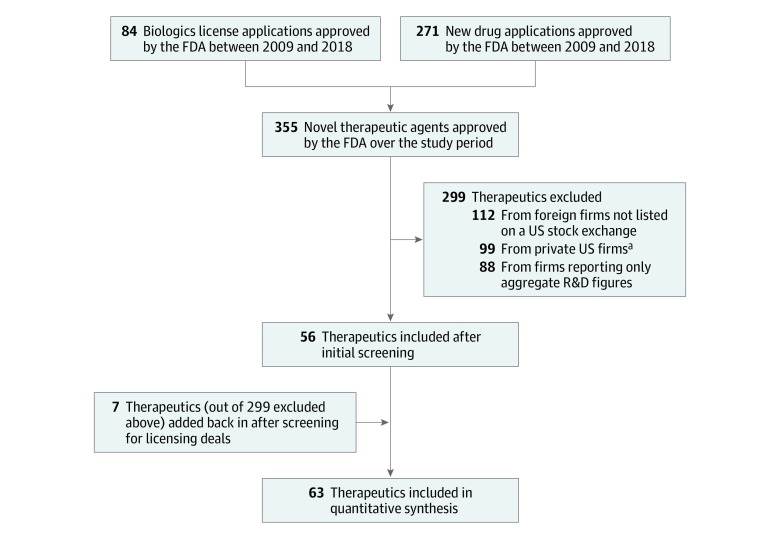
Design and setting: Data were analyzed on new therapeutic agents approved by the US Food and Drug Administration (FDA) between 2009 and 2018 to estimate the research and development expenditure required to bring a new medicine to market. Data were accessed from the US Securities and Exchange Commission, Drugs@FDA database, and ClinicalTrials.gov, alongside published data on clinical trial success rates.
Exposures: Conduct of preclinical and clinical studies of new therapeutic agents.
Main outcomes and measures: Median and mean research and development spending on new therapeutic agents approved by the FDA, capitalized at a real cost of capital rate (the required rate of return for an investor) of 10.5% per year, with bootstrapped CIs. All amounts were reported in 2018 US dollars.
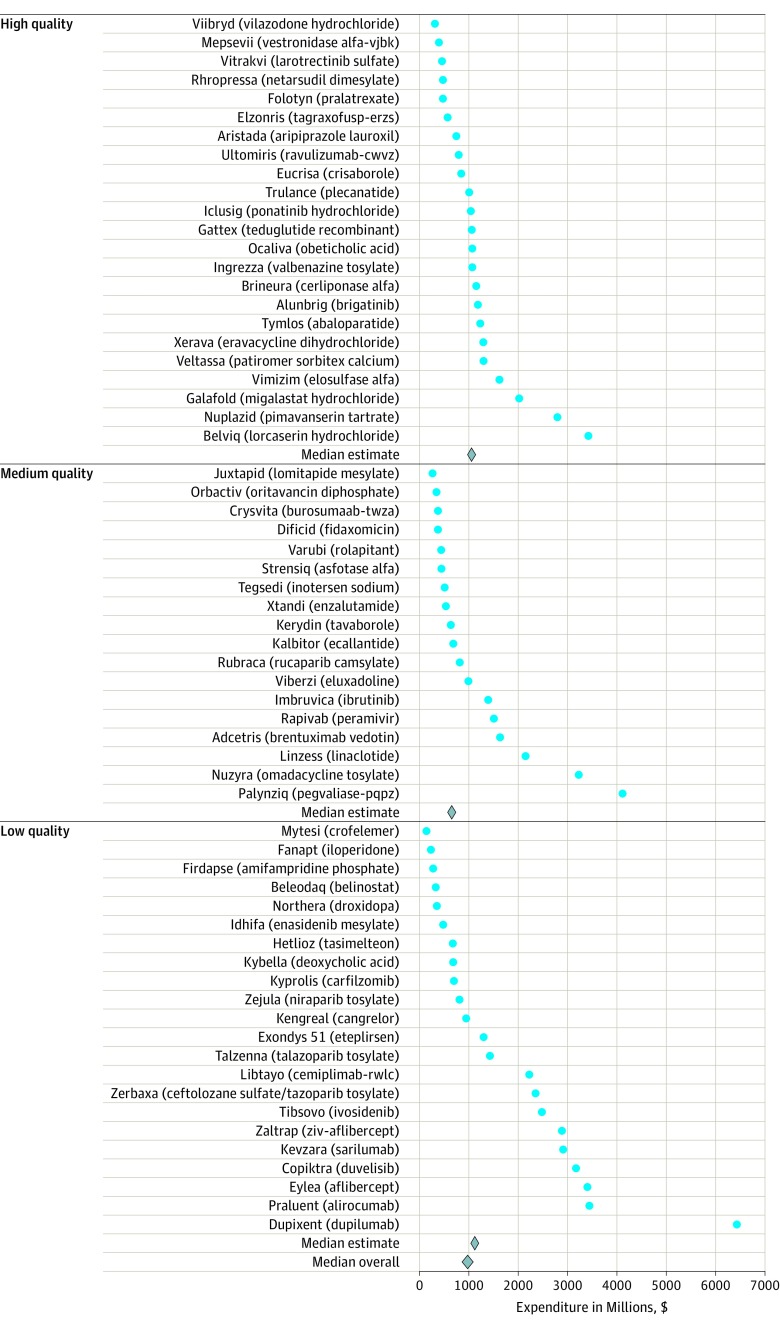
Results: The FDA approved 355 new drugs and biologics over the study period. Research and development expenditures were available for 63 (18%) products, developed by 47 different companies. After accounting for the costs of failed trials, the median capitalized research and development investment to bring a new drug to market was estimated at $985.3 million (95% CI, $683.6 million-$1228.9 million), and the mean investment was estimated at $1335.9 million (95% CI, $1042.5 million-$1637.5 million) in the base case analysis. Median estimates by therapeutic area (for areas with ≥5 drugs) ranged from $765.9 million (95% CI, $323.0 million-$1473.5 million) for nervous system agents to $2771.6 million (95% CI, $2051.8 million-$5366.2 million) for antineoplastic and immunomodulating agents. Data were mainly accessible for smaller firms, orphan drugs, products in certain therapeutic areas, first-in-class drugs, therapeutic agents that received accelerated approval, and products approved between 2014 and 2018. Results varied in sensitivity analyses using different estimates of clinical trial success rates, preclinical expenditures, and cost of capital.
Conclusions and relevance: This study provides an estimate of research and development costs for new therapeutic agents based on publicly available data. Differences from previous studies may reflect the spectrum of products analyzed, the restricted availability of data in the public domain, and differences in underlying assumptions in the cost calculations.
Conflict of interest statement
Figures
Comment in
-
Affording Medicines for Today's Patients and Sustaining Innovation for Tomorrow.JAMA. 2020 Mar 3;323(9):831-833. doi: 10.1001/jama.2020.0167. JAMA. 2020. PMID: 32125383 No abstract available.
-
Are Pharmaceutical Companies Earning Too Much?JAMA. 2020 Mar 3;323(9):829-830. doi: 10.1001/jama.2020.0351. JAMA. 2020. PMID: 32125384 No abstract available.
-
Relentless Prescription Drug Price Increases.JAMA. 2020 Mar 3;323(9):826-828. doi: 10.1001/jama.2020.0359. JAMA. 2020. PMID: 32125385 No abstract available.
-
Research and Development Costs of New Drugs.JAMA. 2020 Aug 4;324(5):516-517. doi: 10.1001/jama.2020.8642. JAMA. 2020. PMID: 32749483 No abstract available.
-
Research and Development Costs of New Drugs.JAMA. 2020 Aug 4;324(5):516. doi: 10.1001/jama.2020.8645. JAMA. 2020. PMID: 32749484 No abstract available.
-
Research and Development Costs of New Drugs.JAMA. 2020 Aug 4;324(5):517. doi: 10.1001/jama.2020.8648. JAMA. 2020. PMID: 32749485 No abstract available.
References
MeSH terms
LinkOut - more resources
Full Text Sources
Other Literature Sources
