

Current and Future Spatiotemporal Patterns of Lyme Disease Reporting in the Northeastern United States
- PMID: 32125426
- PMCID: PMC7054839
- DOI: 10.1001/jamanetworkopen.2020.0319
Current and Future Spatiotemporal Patterns of Lyme Disease Reporting in the Northeastern United States
Abstract
Importance: The incidence and geographic range of Lyme disease continues to increase in the United States because of the expansion of Ixodes scapularis, the species of tick that is the main Lyme disease vector. Currently, no dynamic model for the disease spread exists that integrates information of both acarological and human case surveillance data.
Objective: To characterize the spatiotemporal spread of Lyme disease in humans among counties in US endemic regions.
Design, setting, and participants: This cross-sectional study modeled the spread of Lyme disease county-level case reporting, accounting for county-level demographic factors, environmental factors associated with tick presence and human exposure, and the spatiotemporal association between counties. The analyses were conducted between January and August 2019. The setting was 1405 counties in the following regions of the United States: West North Central, East North Central, New England, Middle Atlantic, and the South. Assessments were based on publicly available Lyme disease case data reported to the US Centers for Disease Control and Prevention (CDC) between January 2000 and December 2017.
Main outcomes and measures: Probability of reporting the first case of Lyme disease by county by year.
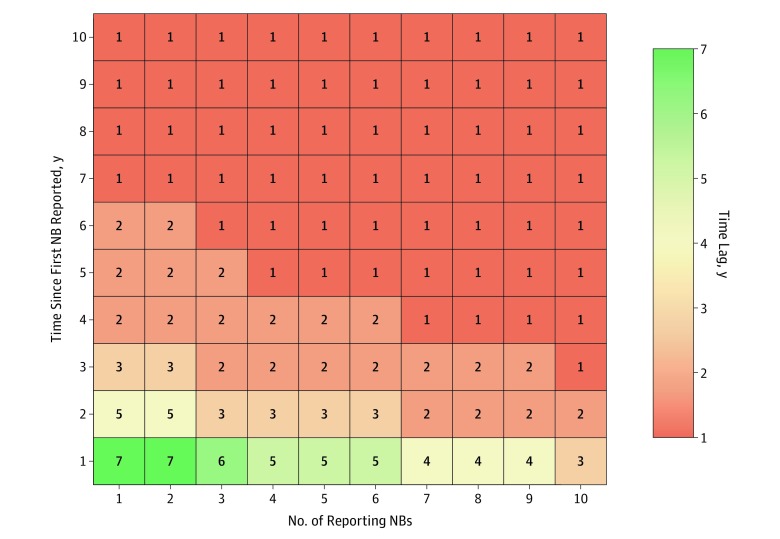
Results: Between 2000 and 2017, a total of 497 569 Lyme disease cases were reported to the CDC in the study area. Reporting a first case of Lyme disease was associated with a county's and county's neighbors' forest coverage, elevation, percentage of population living in the wildland-urban interface, tick presence, county's population size, proportion of neighbors reporting cases, and neighbors' years since first reporting. The model that included these variables showed high predictive power, with a mean area under the receiver operating characteristic curve of 81.1 (95% CI, 68.5-86.2). The model predicted the first reported Lyme disease case a mean (SD) of 5.5 (3.5) years earlier than was reported to the CDC, with a mean spread velocity estimated at 27.4 (95% CI, 13.6-54.4) km per year. Among 162 counties without reported cases, 47 (29.0%) had a high probability of reporting Lyme disease by 2018. The estimated mean time lag between the first reported case in a neighboring county and any county was 7 (95% CI, 3-8) years.
Conclusions and relevance: This study's findings suggest that, if updated regularly and expanded geographically, this predictive model could enable states and counties to develop more specific Lyme disease prevention and control plans, including improved sensitization of the general population and medical community.
Conflict of interest statement
Figures


Comment in
-
Challenges in Predicting Lyme Disease Risk.JAMA Netw Open. 2020 Mar 2;3(3):e200328. doi: 10.1001/jamanetworkopen.2020.0328. JAMA Netw Open. 2020. PMID: 32125424 Free PMC article. No abstract available.
References
Publication types
MeSH terms
Grants and funding
LinkOut - more resources
Full Text Sources
Medical
