

Optimized criteria for locomotion-based healthspan evaluation in C. elegans using the WorMotel system
- PMID: 32126105
- PMCID: PMC7053758
- DOI: 10.1371/journal.pone.0229583
Optimized criteria for locomotion-based healthspan evaluation in C. elegans using the WorMotel system
Abstract
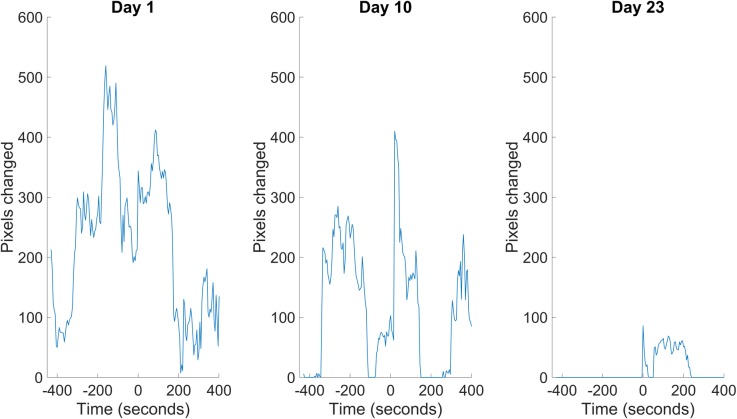
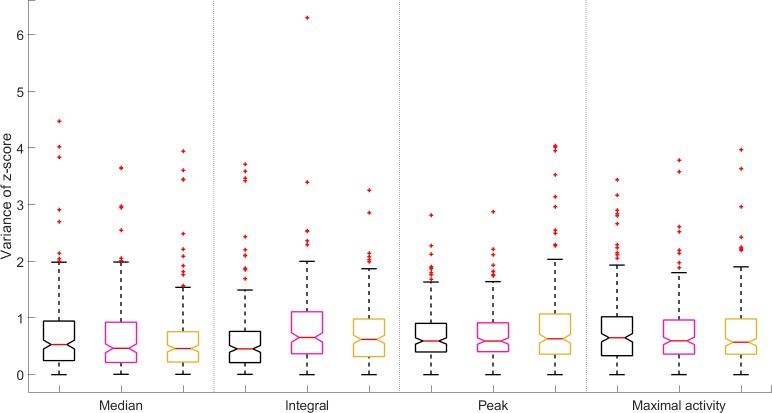
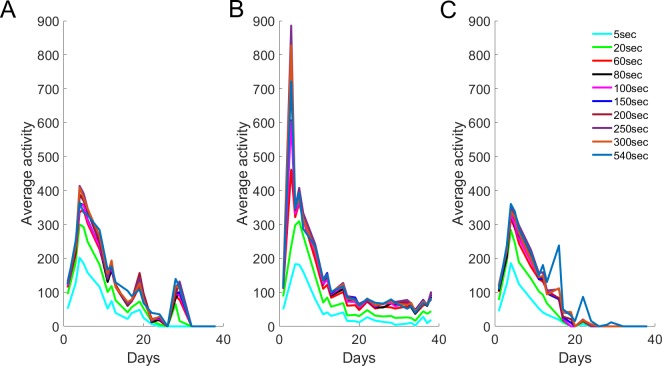
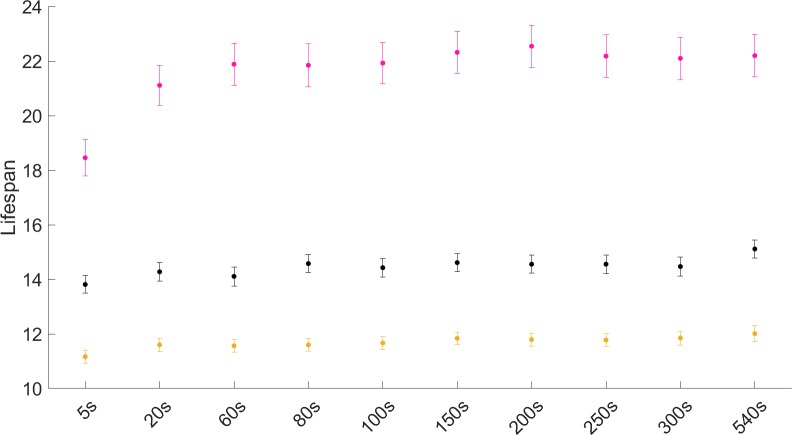
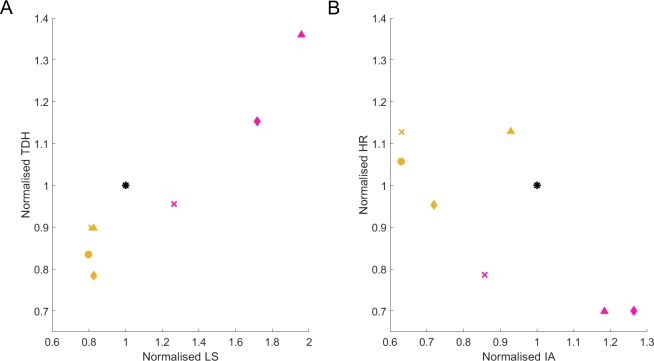
Getting a grip on how we may age healthily is a central interest of biogerontological research. To this end, a number of academic teams developed platforms for life- and healthspan assessment in Caenorhabditis elegans. These are very appealing for medium- to high throughput screens, but a broader implementation is lacking due to many systems relying on custom scripts for data analysis that others struggle to adopt. Hence, user-friendly recommendations would help to translate raw data into interpretable results. The aim of this communication is to streamline the analysis of data obtained by the WorMotel, an economically and practically appealing screening platform, in order to facilitate the use of this system by interested researchers. We here detail recommendations for the stepwise conversion of raw image data into activity values and explain criteria for assessment of health in C. elegans based on locomotion. Our analysis protocol can easily be adopted by researchers, and all needed scripts and a tutorial are available in S1 and S2 Files.
Conflict of interest statement
The authors have declared that no competing interests exist.
Figures


Similar articles
-
Adult-restricted gene knock-down reveals candidates that affect locomotive healthspan in C. elegans.Biogerontology. 2023 Apr;24(2):225-233. doi: 10.1007/s10522-022-10009-8. Epub 2023 Jan 20. Biogerontology. 2023. PMID: 36662373
-
Untangling Longevity, Dauer, and Healthspan in Caenorhabditis elegans Insulin/IGF-1-Signalling.Gerontology. 2018;64(1):96-104. doi: 10.1159/000480504. Epub 2017 Sep 22. Gerontology. 2018. PMID: 28934747 Free PMC article.
-
Heat shock factor 1 prevents the reduction in thrashing due to heat shock in Caenorhabditis elegans.Biochem Biophys Res Commun. 2015 Jul 3;462(3):190-4. doi: 10.1016/j.bbrc.2015.04.086. Epub 2015 Apr 29. Biochem Biophys Res Commun. 2015. PMID: 25935486
-
My adventures with genes from the fountain of youth.Harvey Lect. 2004-2005;100:29-70. Harvey Lect. 2004. PMID: 16970174 Review. No abstract available.
-
Reproduction and longevity: secrets revealed by C. elegans.Trends Cell Biol. 2007 Feb;17(2):65-71. doi: 10.1016/j.tcb.2006.12.004. Epub 2006 Dec 21. Trends Cell Biol. 2007. PMID: 17187981 Review.
Cited by
-
Phenotypic Screening in C. elegans as a Tool for the Discovery of New Geroprotective Drugs.Pharmaceuticals (Basel). 2020 Jul 25;13(8):164. doi: 10.3390/ph13080164. Pharmaceuticals (Basel). 2020. PMID: 32722365 Free PMC article. Review.
-
Adult-restricted gene knock-down reveals candidates that affect locomotive healthspan in C. elegans.Biogerontology. 2023 Apr;24(2):225-233. doi: 10.1007/s10522-022-10009-8. Epub 2023 Jan 20. Biogerontology. 2023. PMID: 36662373
-
High temporal resolution measurements of movement reveal novel early-life physiological decline in C. elegans.PLoS One. 2022 Feb 2;17(2):e0257591. doi: 10.1371/journal.pone.0257591. eCollection 2022. PLoS One. 2022. PMID: 35108272 Free PMC article.
-
Multiview motion tracking based on a cartesian robot to monitor Caenorhabditis elegans in standard Petri dishes.Sci Rep. 2022 Feb 2;12(1):1767. doi: 10.1038/s41598-022-05823-6. Sci Rep. 2022. PMID: 35110654 Free PMC article.
-
The Replica Set Method is a Robust, Accurate, and High-Throughput Approach for Assessing and Comparing Lifespan in C. elegans Experiments.Front Aging. 2022 Apr 28;3:861701. doi: 10.3389/fragi.2022.861701. eCollection 2022. Front Aging. 2022. PMID: 35821830 Free PMC article.
References
-
- Ross JL, Yudin J, Galluzzi K. The geriatric assessment team: A case report. Fam Syst Med 1992;10:213–8. 10.1037/h0089169 - DOI
-
- Lemmink KAPM, Han K, De Greef MHG, Rispens P, Stevens M. Reliability of the Groningen Fitness Test for the Elderly. J Aging Phys Act 2001;9:194–212. 10.1123/japa.9.2.194 - DOI
-
- Ito T. Comprehensive Physical Function Assessment in Elderly People. Clin. Phys. Ther., InTech; 2017. 10.5772/67528 - DOI
Publication types
MeSH terms
Substances
Grants and funding
LinkOut - more resources
Full Text Sources
