. 2020 Mar 10;4(5):830-844.
doi: 10.1182/bloodadvances.2019000779.

Integrative analysis of the genomic and transcriptomic landscape of double-refractory multiple myeloma

Affiliations

Integrative analysis of the genomic and transcriptomic landscape of double-refractory multiple myeloma

Bachisio Ziccheddu et al. Blood Adv. .

Abstract

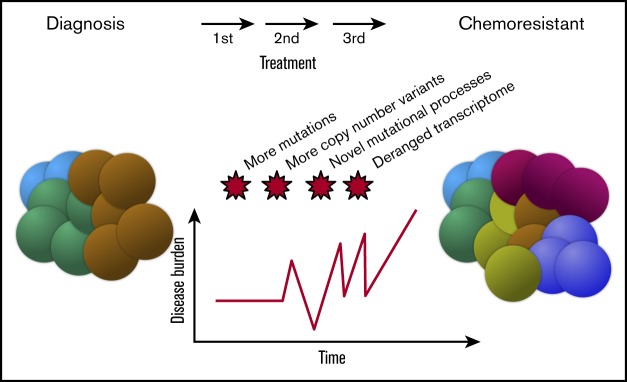
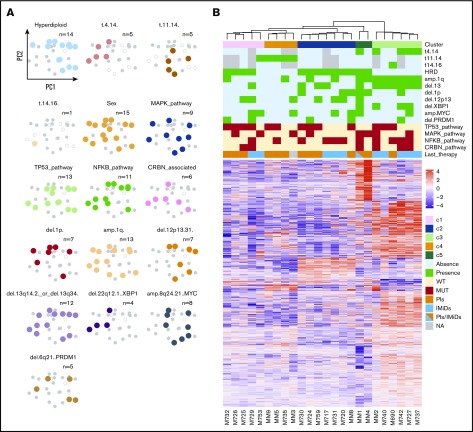
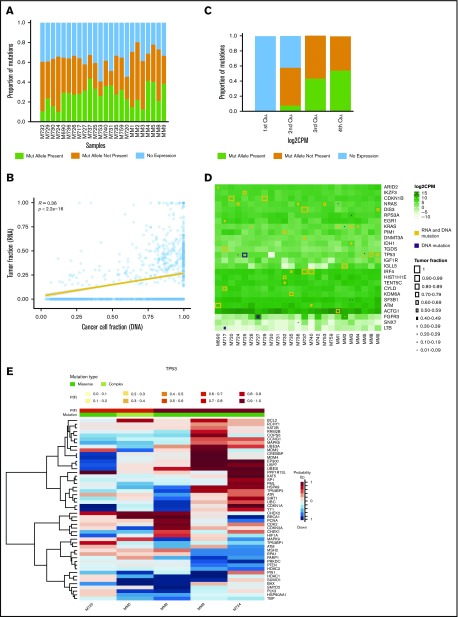
In multiple myeloma, novel treatments with proteasome inhibitors (PIs) and immunomodulatory agents (IMiDs) have prolonged survival but the disease remains incurable. At relapse, next-generation sequencing has shown occasional mutations of drug targets but has failed to identify unifying features that underlie chemotherapy resistance. We studied 42 patients refractory to both PIs and IMiDs. Whole-exome sequencing was performed in 40 patients, and RNA sequencing (RNA-seq) was performed in 27. We found more mutations than were reported at diagnosis and more subclonal mutations, which implies ongoing evolution of the genome of myeloma cells during treatment. The mutational landscape was different from that described in published studies on samples taken at diagnosis. The TP53 pathway was the most frequently inactivated (in 45% of patients). Conversely, point mutations of genes associated with resistance to IMiDs were rare and were always subclonal. Refractory patients were uniquely characterized by having a mutational signature linked to exposure to alkylating agents, whose role in chemotherapy resistance and disease progression remains to be elucidated. RNA-seq analysis showed that treatment or mutations had no influence on clustering, which was instead influenced by karyotypic events. We describe a cluster with both amp(1q) and del(13) characterized by CCND2 upregulation and also overexpression of MCL1, which represents a novel target for experimental treatments. Overall, high-risk features were found in 65% of patients. However, only amp(1q) predicted survival. Gene mutations of IMiD and PI targets are not a preferred mode of drug resistance in myeloma. Chemotherapy resistance of the bulk tumor population is likely attained through differential, yet converging evolution of subclones that are overall variable from patient to patient and within the same patient.


Conflict of interest statement

Conflict-of-interest disclosure: N.B. received honoraria from Celgene, Amgen, and Janssen. The remaining authors declare no competing financial interests.

Figures

None
Graphical abstract
Figure 1.
Figure 1.
Mutations and subclonality in the cohort. (A) Stacked bar chart showing the number of variants per patient (left y-axis). Bars indicate the contributions of clonal variants and subclonal variants. Yellow dots represent the percentage of subclonal variants per patient (right y-axis). (B) Scatter plot representing correlation between the number of subclonal mutations and the total number of mutations. Each dot represents a patient. The correlation was computed by using Pearson’s correlation coefficient. (C) Box plot representing the distribution of variant number in NDMM (samples pertain to the CoMMpass data set) and RRMM. First, second, and third quartiles are represented by horizontal bars, and the whiskers point to the 1.5 interquartile range of the upper quartile and lower quartile. To make this comparison, our cohort was re-analyzed with MuTect, Strelka, and Seurat to ensure accuracy of the analysis. (D) Waterfall plot showing the overall number of mutations for the most commonly mutated genes and their prevalence (% of mutations) in patients. Genes mutated at a statistically significant rate are indicated by an asterisk.
Figure 2.
Figure 2.
Genomic makeup of RRMM. (A) Oncoplot columns showing genomic alterations for the patients in the study: cytogenetic events are in red in the top part (absence of information [NA] in white). Mutations are in the bottom part, color-coded by type. Subclonal mutations have a yellow square in the middle, and biallelic instances of mutations or deletions are outlined in black. (B) Circos plots summarizing the genomic makeup of each patient. Genomic coordinates on chromosomes are on the outer ring; then, working inward, copy number (CN) status (green, deletion or loss; red, amplification or gain), mutations (variants), and interchromosomal rearrangements. (C) Bar chart of the most commonly mutated pathways in the cohort. MAPK_pathway: KRAS, NRAS, BRAF, and FGFR3 mutations; NF-κB pathway: CYLD, BIRC2, BIR3, TRAF2, TRAF3, NFKBIA, and NFKBIE mutations and/or deletions; CRBN pathway: IKZF1 and IKZF3 mutations and CRBN, RBX1, DDB1, and CUL4B mutations and/or deletions; proteasome subunit: mutations in proteasome subunit genes; and TP53 pathway: TP53, ATM, and ATR mutations and/or deletions. (D) Breakdown of the patients based on the presence or absence of high-risk features; left-most bar, % contribution of each feature. (E) Frequency of mutations according to the last line of treatment.
Figure 3.
Figure 3.
Mutational signatures in RRMM. (A) A 96-class plot of mutational frequencies in the pyrimidine context, color-coded by nucleotide change and further subdivided on the basis of the 5′ and 3′ nucleotides. (B) De novo extraction of the mutational signatures contributing to the spectrum. (C) Proportion of mutations caused by signature MM1 in people who did not receive (blue) or did receive (yellow) high-dose melphalan before sampling.
Figure 4.
Figure 4.
Transcriptomic profile of RRMM patients. (A) Principal component analysis based on genetic features: samples are represented as dots in the space identified by the 2 principal components and are color-coded based on the presence or absence of the genetic feature listed in the top label: color: present; gray, absent; empty, information not available. (B) Unsupervised clustering of the samples based on their gene expression profile. Genomic features are annotated above the horizontal white line (green, cytogenetic events; red, mutations), as is last treatment (yellow, bortezomib; light blue, lenalidomide).
Figure 5.
Figure 5.
Expression of gene mutations. (A) Stacked bar chart showing the proportion of mutations for each patient that are expressed (present) or not because the mutated (mut) allele is not expressed (not present) or the gene is not expressed at all. (B) Scatter plot showing a correlation between the cancer cell fraction by DNA analysis and the tumor fraction by RNA analysis, the latter representing the ratio between mutant and wild-type transcripts. (C) Stacked bar chart showing the proportion of mutations that are expressed or not expressed for each quartile (Qu) of gene expression because the mutated allele is not expressed (not present) or the gene is not expressed at all. (D) Heat map for the most commonly mutated genes (in rows) showing their expression level in each patient (columns); whether a mutation is present in both RNA and DNA samples or in DNA samples only; and the cancer cell fraction of that mutation, which is proportional to the size of the square. (E) Heat map showing the probabilities of genes being dysregulated in patients with mutated TP53. P(F) denotes the probability that the mutation affects the expression in the same individual; mutation type can be either missense or complex (complex indicates that the patient has more than 1 mutation). The probability scale indicates the probability that the gene is upregulated (red) or downregulated (blue).
Figure 6.
Figure 6.
Survival analysis. (A-B) Kaplan-Meier plot of the OS and PFS of the cohort. (C-D) A significant negative effect is observed on PFS (but not on OS after P value correction) in patients harboring amplification of chr1q (ie, >3 copies). (E-F) No significant effect is observed in patients showing a double-hit of the TP53 locus. (G-H) A trend toward shorter survival is observed in patients with deletion or mutations of the PRDM1 gene in chr6q. For all plots, numbers of patients at risk are shown in tables below the graphs.

References

    1. Kumar SK, Rajkumar SV, Dispenzieri A, et al. . Improved survival in multiple myeloma and the impact of novel therapies. Blood. 2008;111(5):2516-2520. - PMC - PubMed
    1. Kumar SK, Lee JH, Lahuerta JJ, et al. ; International Myeloma Working Group . Risk of progression and survival in multiple myeloma relapsing after therapy with IMiDs and bortezomib: a multicenter international myeloma working group study. Leukemia. 2012;26(1):149-157. - PMC - PubMed
    1. Palumbo A, Avet-Loiseau H, Oliva S, et al. . Revised international staging system for multiple myeloma: A report from International Myeloma Working Group. J Clin Oncol. 2015;33(26):2863-2869. - PMC - PubMed
    1. Chapman MA, Lawrence MS, Keats JJ, et al. . Initial genome sequencing and analysis of multiple myeloma. Nature. 2011;471(7339):467-472. - PMC - PubMed
    1. Bolli N, Avet-Loiseau H, Wedge DC, et al. . Heterogeneity of genomic evolution and mutational profiles in multiple myeloma. Nat Commun. 2014;5(1):2997. - PMC - PubMed

Publication types

Substances

LinkOut - more resources