. 2020 May 6;106(3):421-437.e11.
doi: 10.1016/j.neuron.2020.01.038. Epub 2020 Mar 2.

Tau Reduction Prevents Key Features of Autism in Mouse Models

Affiliations

Tau Reduction Prevents Key Features of Autism in Mouse Models

Chao Tai et al. Neuron. .

Abstract

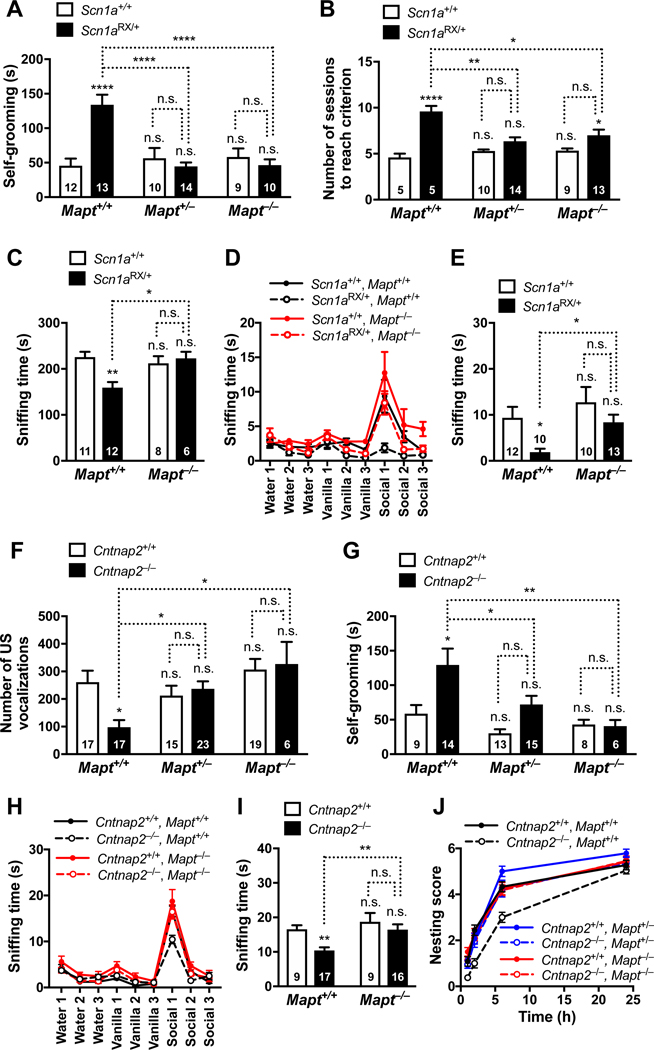
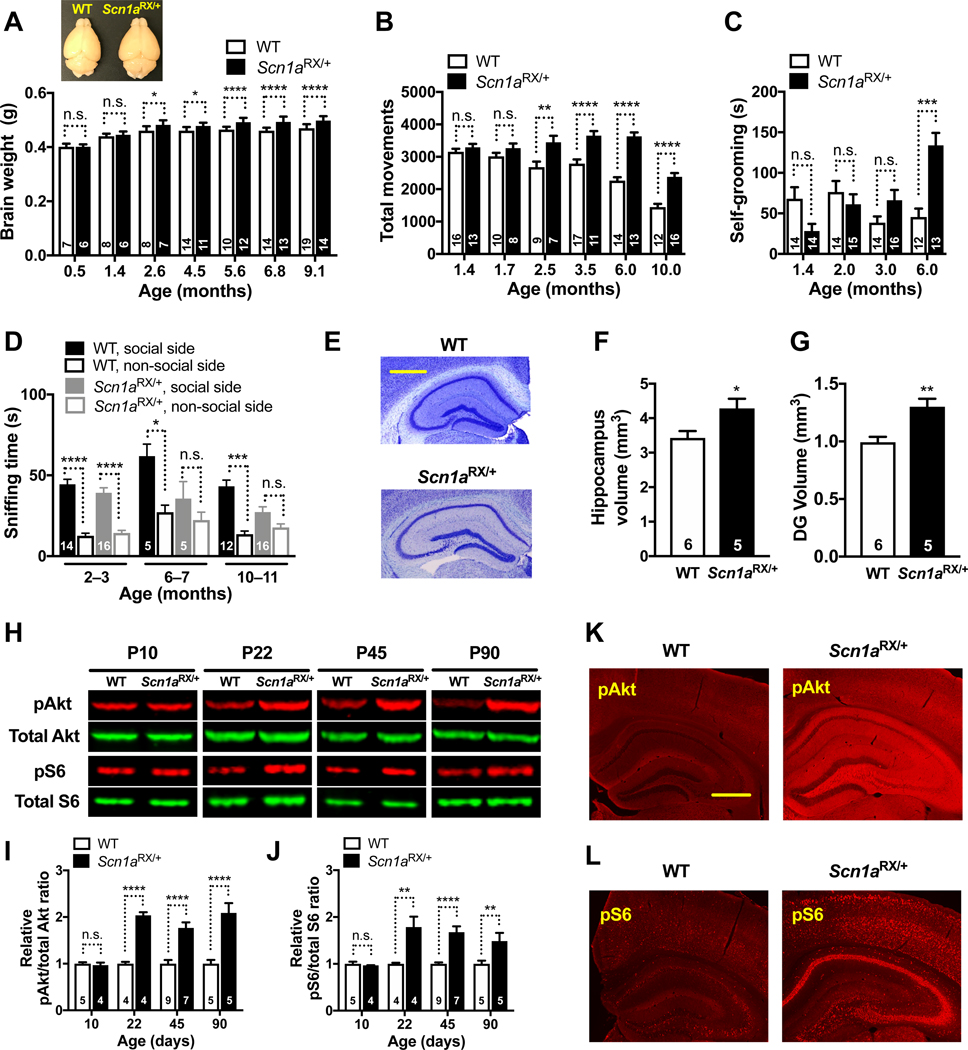
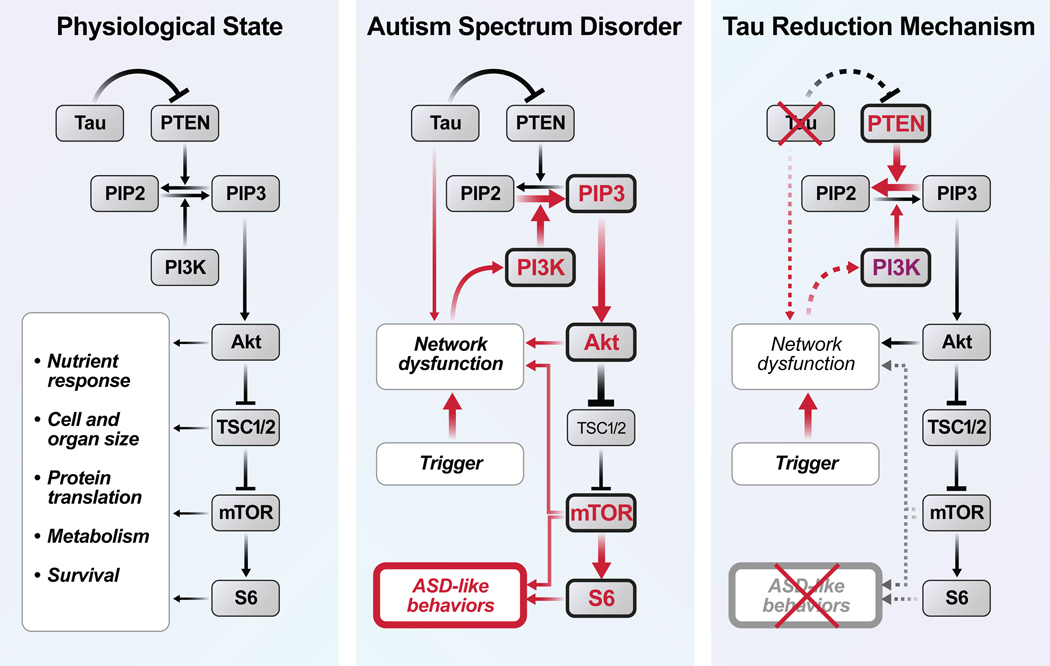
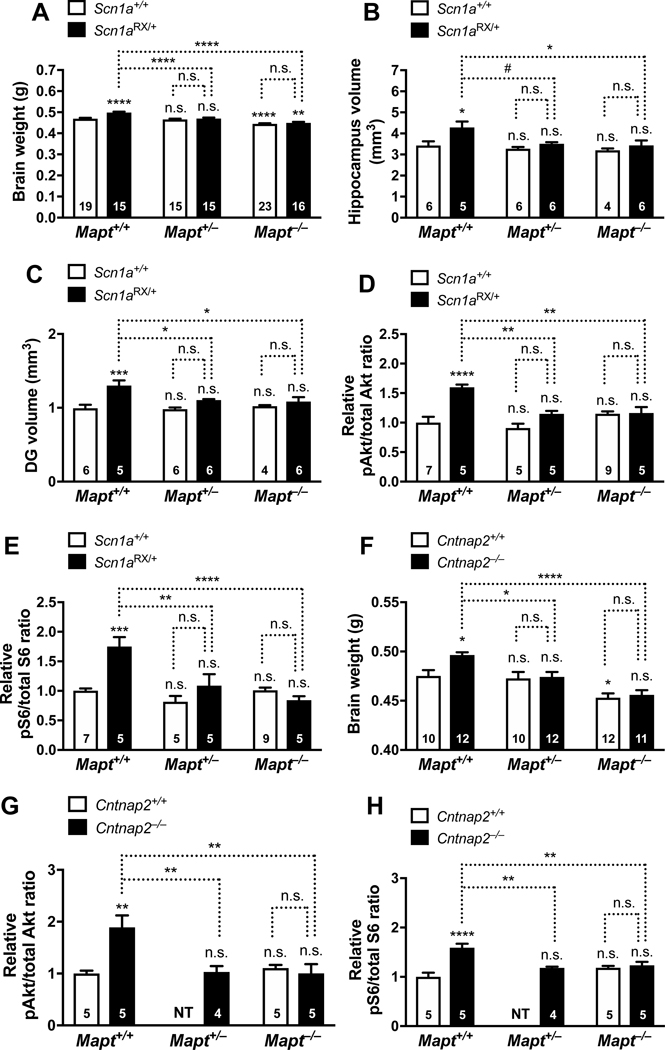
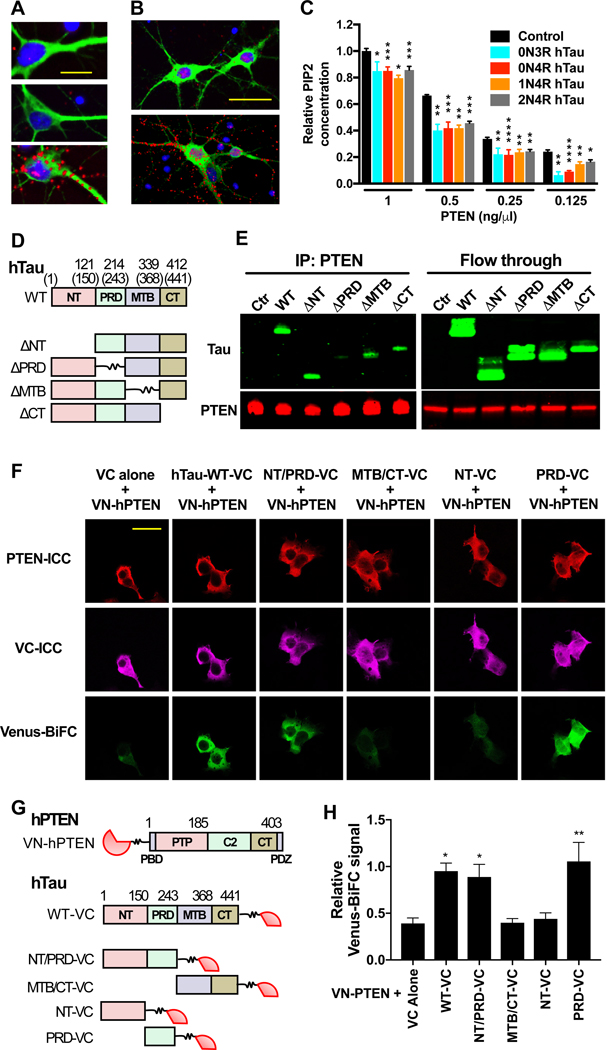
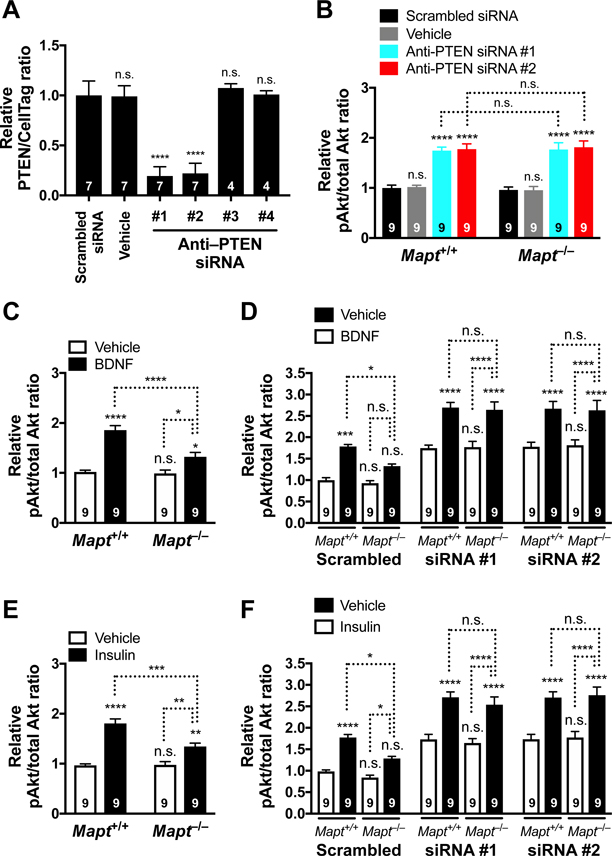
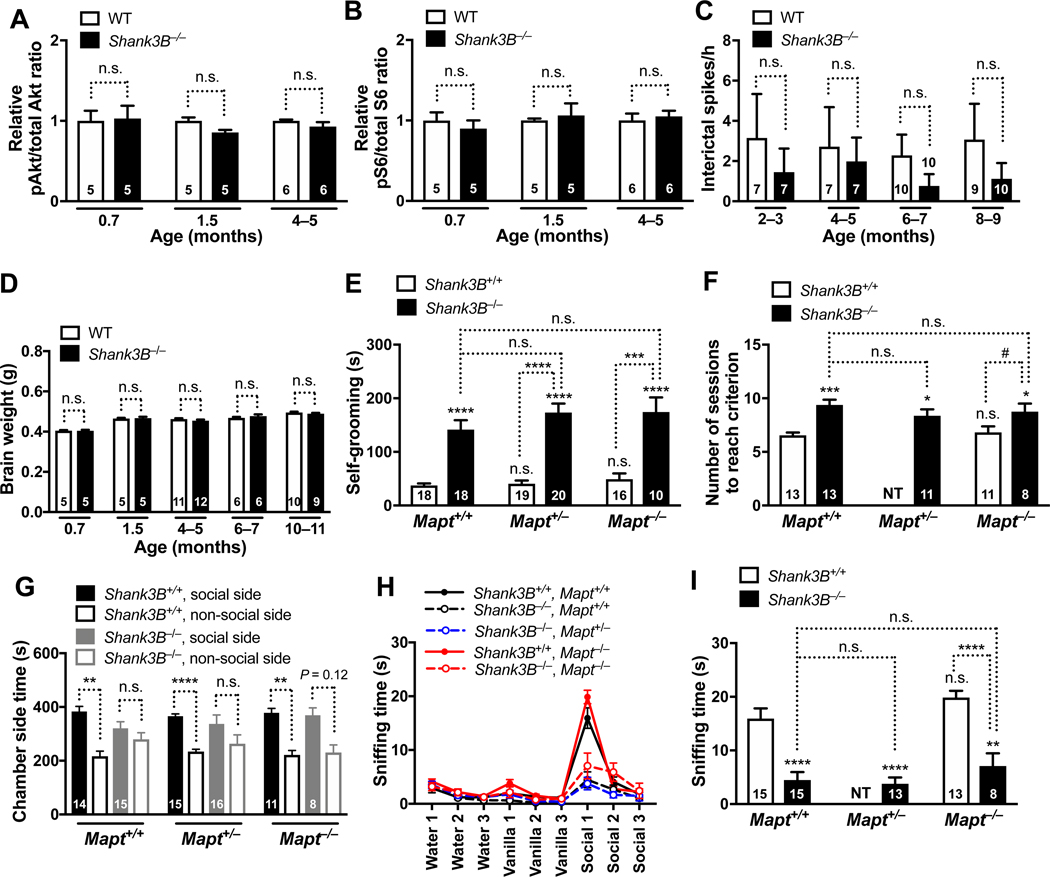
Autism is characterized by repetitive behaviors, impaired social interactions, and communication deficits. It is a prevalent neurodevelopmental disorder, and available treatments offer little benefit. Here, we show that genetically reducing the protein tau prevents behavioral signs of autism in two mouse models simulating distinct causes of this condition. Similar to a proportion of people with autism, both models have epilepsy, abnormally enlarged brains, and overactivation of the phosphatidylinositol 3-kinase (PI3K)/Akt (protein kinase B)/ mammalian target of rapamycin (mTOR) signaling pathway. All of these abnormalities were prevented or markedly diminished by partial or complete genetic removal of tau. We identify disinhibition of phosphatase and tensin homolog deleted on chromosome 10 (PTEN), a negative PI3K regulator that tau controls, as a plausible mechanism and demonstrate that tau interacts with PTEN via tau's proline-rich domain. Our findings suggest an enabling role of tau in the pathogenesis of autism and identify tau reduction as a potential therapeutic strategy for some of the disorders that cause this condition.

Keywords: Akt; Cntnap2; PI3 kinase; PTEN; Scn1a; Shank3; autism spectrum disorders; mTOR; megalencephaly; tau.


Conflict of interest statement

Declaration of Interests L.M. is a co-inventor on patents filed by the Gladstone Institutes that focus on tau reduction as a strategy to block neural network dysfunction (U.S. patent number 9,189,982 for “Agents that Reduce Neuronal Overexcitation,” issued December 1, 2015; U.S. patent number 9,084,813 for “Agents that Reduce Neuronal Overexcitation,” issued July 21, 2015). He is the principal investigator on a research project to develop tau-lowering small-molecule drugs that is supported, in part, by a corporate-sponsored research agreement between the Gladstone Institutes and Cure Network Dolby Acceleration Partners. He also serves on the scientific advisory boards of Arvinas Operations, Biogen, and Dolby Family Ventures and has provided consulting services to Sangamo Therapeutics.

Figures

Figure 1 |
Figure 1 |. Tau Reduction Prevents Autism-like Behaviors in Scn1aRX/+ and Cntnap2/ Mice
(A–E) Male Scn1a+/+ and Scn1aRX/+ mice with 2, 1, or 0 Mapt alleles were assessed for autism-like behaviors at 4–7 months of age. In all figures, numbers inside or above bars indicate number of mice per group unless indicated otherwise. (A) Self-grooming behavior. The time mice spent grooming themselves was recorded for 10 minutes. (B) Relearning test. Mice were first trained to locate a submerged escape platform at the end of one arm of a water T-maze (Figure S1A). The platform was then moved to the end of the opposite arm and the number of training sessions mice required to learn the new platform location was counted. (C) Reciprocal social interaction test. Sniffing time in pairs of freely interacting mice of matched sex, age and genotype was measured for 10 minutes. (D–E) Olfactory habituation/dishabituation test. (D) Mice were consecutively presented with three olfactory stimuli (3 trials of 2 minutes per odor) and the amount of time they spent sniffing the stimulus was recorded. Male mouse bedding was used as the social odor. Habituation to each odor was measured as the slopes of linear regression lines through the three trials. All groups of mice displayed similar habituation to water and vanilla; for habituation to social odor, Scn1aRX/+Mapt+/+ mice differed from Scn1a+/+Mapt+/+ (P = 0.0015) and Scn1aRX/+Mapt−/− (P = 0.0019) mice, as determined by generalized estimating equation (GEE) framework analysis. Dishabituation was measured as the difference of sniffing time between Vanilla1 and Water3, and Social1 and Vanilla3. All groups of mice displayed similar dishabituation from water to vanilla; for dishabituation from vanilla to social odor, Scn1aRX/+Mapt+/+ mice differed from Scn1a+/+Mapt+/+ (P = 0.023) and Scn1aRX/+Mapt−/− (P = 0.026) mice. n = 10–13 mice/genotype. (E) Amount of time mice spent sniffing the social odor during the first trial for that odor. (F–J) Cntnap2+/+ and Cntnap2−/− mice with 2, 1, or 0 Mapt alleles were assessed for autism-like behaviors. (F) Number of ultrasonic (US) vocalizations made by male and female mouse pups (P5) after separation from their dam. (G) Self-grooming behavior of 3–4-month-old male mice measured as in (A). (H–I) Olfactory habituation/dishabituation test in 7–11-month-old male mice carried out as in (D–E). (H) All groups of mice displayed similar habituation to water and vanilla; for habituation to social odor, Cntnap2−/−Mapt+/+ mice differed from Cntnap2+/+Mapt+/+ (P < 0.0001) and Cntnap2−/−Mapt−/− (P = 0.0035) mice. All groups of mice displayed similar dishabituation from water to vanilla; for dishabituation from vanilla to social odor, Cntnap2−/−Mapt+/+ mice differed from Cntnap2+/+Mapt+/+ (P < 0.0001) and Cntnap2−/−Mapt−/− (P = 0.001) mice. n = 9–17 mice/genotype. (I) Amount of time mice spent sniffing the social odor during the first trial for that odor. (J) Nest building was scored 1, 2, 6, and 24 hours after 7–11-month-old male mice were given nesting material. Area under the curve was computed for each mouse as a measure of nest building performance. n = 12–24 mice/genotype. By two-way ANOVA with Holm-Sidak test, Cntnap2−/− Mapt+/+ mice differed from Cntnap2+/+Mapt+/+ (P = 0.042) and Cntnap2+/+Mapt−/− mice (P = 0.042) and showed a strong trend to also differ from Cntnap2−/−Mapt+/ mice (P = 0.059). Cntnap2+/+Mapt+/+ mice did not differ from Cntnap2+/+Mapt+/ (P = 0.77) or Cntnap2+/+Mapt−/− (P > 0.99) mice. *P < 0.05, **P < 0.01, ***P < 0.001, ****P < 0.0001 vs. Scn1a+/+Mapt+/+ (A–E) or Cntnap2+/+Mapt+/+ (F–J) mice, or as indicated by brackets, determined by two-way ANOVA with Holm-Sidak test (A, B, C, E, F, I, J), GEE framework with Holm-Sidak test (D, H), or multiple Welch’s t tests with Holm-Sidak correction (G). Interaction by two-way ANOVA between Scn1a and Mapt genotypes: (A) P < 0.0001, F2, 65 = 13.66; (B) P = 0.0032, F2, 50 = 6.44; (C) P = 0.0084, F1, 33 = 7.86; (E) P = 0.48, F1, 41 = 0.50; and between Cntnap2 and Mapt genotypes: (F) P = 0.0187, F2, 91 = 4.16; (I) P = 0.23, F1, 47 = 1.46; (J) P = 0.18, F2, 104 = 1.77. n.s., not significant. Values are mean ± SEM.
Figure 2 |
Figure 2 |. Development of Autism-like Behaviors is Associated with Megalencephaly and Overactivation of the PI3K/Akt/mTOR Pathway in Scn1aRX/+ Mice
Scn1a+/+ (WT) and Scn1aRX/+ mice on the Mapt+/+ background were compared at different ages. (A) Brain weights of male mice. Representative brain images are shown above. Interaction between age and brain weight by two-way ANOVA: P = 0.006, F6, 135 = 3.179. Brain weights of female mice and body weights of the same female and male mice are shown in Figure S3A–C. (B–D) Different groups of mice were tested at different ages in three behavioral paradigms. (B) Number of total movements in the open field recorded for 10 minutes. Interaction between age and movements by two-way ANOVA: P < 0.0001, F5, 134 = 24.96. (C) Time spent self-grooming. (D) Social interactions measured as in Figure S1C. (E–G) Volumes of the hippocampus (F) and dentate gyrus (G) measured at 9 months of age. The photomicrographs in (E) are representative images of Nissl-stained coronal hippocampal sections. Scale bars: 0.5 mm. (H–J) Hippocampal levels of pAkt, total Akt, pS6 (Ser235/236), and total S6 were determined by western blot analysis at the indicated postnatal (P) ages. (H) Representative western blots. (I–J) Relative hippocampal signal ratios for pAkt/total Akt (I) and pS6 (Ser235/236)/total S6 (J). For each age, measurements were normalized to the average of WT samples on the same gel (defined as 1.0). By two-way ANOVA, interaction between age and pAkt (I): P = 0.0004, F3, 35 = 7.77; and between age and pS6 (Ser235/236) (J): P = 0.0049, F3, 35 = 5.11. Similar results were obtained for pS6 (Ser240/244), as shown in Figure S4D. (K and L) Images of coronal hippocampal sections depicting typical levels of pAkt (K) and pS6 (L) immunoreactivities at P30. Scale bars: 0.5 mm. *P < 0.05, **P < 0.01, ***P < 0.001, ****P < 0.0001 vs. age-matched WT or as indicated by brackets, determined by two-way ANOVA with Holm-Sidak test (A, B, I, J), Kruskal-Wallis and Dunn tests (C), two-tailed paired t tests with Holm-Sidak correction (D), or unpaired, two-tailed Student’s t test (F, G). n.s., not significant. Values are mean ± SEM.
Figure 3 |
Figure 3 |. Working Model
By causing network dysfunction or through more direct mechanisms, different triggers of ASD pathogenesis overactivate the PI3K/Akt/mTOR pathway, which in turn contributes to the development of core autism symptoms through diverse anatomical (e.g., megalencephaly, neuronal hypertrophy, and hyperconnectivity) and functional (e.g., hypersynchrony, E/I imbalance, and alterations in synaptic transmission, plasticity or scaling) mechanisms. Tau reduction counteracts this process by reducing network dysfunction and releasing the activity of PTEN, which is inhibited by tau and suppresses the activity of the PI3K/Akt/mTOR pathway.
Figure 4 |
Figure 4 |. Tau Reduction Prevents Megalencephaly and Overactivation of the PI3K/Akt/mTOR Pathway in ASD Model
Some of the measures described in Figure 2 were compared in male and female Scn1a+/+ and Scn1aRX/+ mice (A–E) and in Cntnap2+/+ and Cntnap2−/− mice (F–H) that had 2, 1, or 0 Mapt alleles. (A) Brain weights of Scn1a+/+ and Scn1aRX/+ mice at 9–10 months of age. (B–C) Volumes of the hippocampus (B) and dentate gyrus (C) of Scn1a+/+ and Scn1aRX/+ mice at 9–10 months. (D–E) Hippocampal pAkt/total Akt (D) and pS6 (Ser235/236)/total S6 (E) ratios of Scn1a+/+ and Scn1aRX/+ mice at P45. Similar results were obtained for pS6 (Ser240/244), as shown in Figure S4E. (F) Brain weights of Cntnap2+/+ and Cntnap2−/− mice at 9–10 months. (G–H) Hippocampal pAkt/total Akt (G) and pS6 (Ser235/236)/total S6 (H) ratios of Cntnap2+/+ and Cntnap2−/− mice at 6–7 months. To combine data from independent experiments, measurements in (D, E, G, H) were normalized to the mean ratios in Scn1a+/+Mapt+/+ (D, E) or Cntnap2+/+Mapt+/+ (F–H) mice (defined as 1.0). #P = 0.062, *P < 0.05, **P < 0.01, ***P < 0.001, ****P < 0.0001 vs. Scn1a+/+Mapt+/+ mice (A–E) or Cntnap2+/+Mapt+/+ mice (F–H), or as indicated by brackets, determined by two-way ANOVA (A–F) or one-way ANOVA (G and H) followed by Holm-Sidak test. Interaction between Scn1a and Mapt genotypes by two-way ANOVA: (A) P = 0.0018, F2, 97 = 6.73; (B) P = 0.16, F2, 27 = 1.95; (C) P = 0.032, F2, 27 = 3.92; (D) P = 0.0011, F2, 30 = 8.59; (E) P = 0.0003, F2, 30 = 10.88; or between Cntnap2 and Mapt genotypes: (F) P = 0.090, F2, 61 = 2.50. n.s., not significant. NT: Cntnap2+/+Mapt+/– mice were not tested in the experiments shown in (G, H). Values are mean ± SEM.
Figure 5 |
Figure 5 |. Tau Interacts with PTEN through Tau’s PRD and Restrains PTEN’s Lipid Phosphatase Activity
(A–B) Colocalization of tau and PTEN in primary cortical neurons analyzed by PLA. (A) WT rat neurons (DIV 10) were labeled with the tau antibody Tau5 (top), a PTEN antibody (middle), or both (bottom). The PLA signal (red) indicates close proximity of the antigens. Neurons were counterstained with DAPI (blue) and an antibody to MAP2 (green). Scale bar: 30 μm. (B) Mapt−/− mouse neurons were transduced on DIV 7 with lentiviral vectors encoding GFP alone (top) or GFP and 0N4R mouse tau (bottom), labeled with antibodies against tau (Tau5) and PTEN, and subjected to PLA on DIV 10. Scale bar: 50 μm. Some of the PLA signals in (A) and (B) appear to reside outside of cells because of weak MAP2 or GFP staining of the fine neuritic processes with which they are associated. (C) Lipid phosphatase activity of PTEN measured under cell-free conditions in the presence of different recombinant human tau species. Albumin was used as the negative control (Control). n = 3 independent experiments, each including two to three replicates per condition. To combine data from independent experiments, measurements in (C) were normalized to the mean PIP2 concentration at 1 ng/μl PTEN with albumin (defined as 1.0). (D–H) Analysis of interactions between hTau and hPTEN in transiently transfected HEK-293 cells. (D) Schematic of WT 1N4R hTau and deletion mutants lacking the indicated domains. Numbers indicate amino acid positions in 1N4R hTau and those in parentheses in 2N4R hTau. (E) Western blot analysis of immunoprecipitates (left) and column flow through (right) from cells expressing GFP-P2A alone (Ctr) or the constructs in (D), after immunoprecipitation of cell lysates with an antibody against PTEN. Blots were probed with antibodies to tau (Tau46 plus Tau5) and PTEN. Similar results were obtained in two additional experiments (not shown). (F and G) BiFC assay of HEK-293 cells expressing the constructs indicated at the top in (F) and shown in (G). WT human PTEN (hPTEN: PBD, PIP2 binding domain; PTP, protein tyrosine phosphatase domain; CT, C-tail domain) was tagged with VN, and WT 2N4R hTau and its mutants were tagged with VC. Numbers indicate amino acid positions in hPTEN and 2N4R hTau. hPTEN and VC were detected by immunocytochemistry (ICC). Interactions between VN-hPTEN and hTau-VC were detected by Venus fluorescence resulting from close proximity between VN and VC. Scale bar: 40 μm. (H) Quantitation of BiFC-Venus signals normalized to VC immunoreactivity. n = 3 independent experiments, each including two to three coverslips/condition. *P < 0.05, **P < 0.01, ***P < 0.001, ****P < 0.0001 vs. PTEN concentration-matched control (C) or VC alone (H), determined by multiple Welch’s t tests (C) or one-way ANOVA with Holm-Sidak test (H). n.s., not significant. Values are means ± SEM.
Figure 6 |
Figure 6 |. PTEN Is Required for Tau Reduction Effects on PI3K Signaling
(A) Relative PTEN levels in cultures of primary Mapt+/+ mouse neurons treated on DIV 7 with scrambled siRNA, vehicle (1x siRNA buffer, 1:100), or anti-PTEN siRNAs #1 to #4. PTEN protein levels were determined on DIV 11 by In-Cell Western assay. Normalization to CellTag 700 was used to control for well-to-well variation in cell numbers. Representative PTEN and CellTag 700 signals are shown in Supplemental Figure 6A–B. (B) Relative pAkt levels in Mapt+/+ and Mapt−/− neurons treated on DIV 7 with scrambled siRNA, vehicle (1x siRNA buffer, 1:100), or anti-PTEN siRNAs #1 or #2. Relative pAkt/total Akt signal ratios were determined on DIV 11. Representative pAkt and total Akt signals are shown in Supplemental Figure 6D. (C) Relative pAkt levels in Mapt+/+ and Mapt−/− neurons that were treated with BDNF (100 ng/mL) or vehicle (water, 1:100) for 10 min on DIV 11. (D) Relative pAkt levels in Mapt+/+ and Mapt−/− neurons that were treated on DIV 7 with scrambled siRNA or with anti-PTEN siRNAs #1 or #2, and on DIV 11 with BDNF or vehicle (water, 1:100) as in (C). (E) Relative pAkt levels in Mapt+/+ and Mapt−/− neurons that were treated with insulin (5 μg/mL) or vehicle (water, 1:100) for 10 min on DIV 11. (F) Relative pAkt levels in Mapt+/+ and Mapt−/− neurons that were treated on DIV 7 with scrambled siRNA or with anti-PTEN siRNAs #1 or #2, and on DIV 11 with insulin or vehicle (water, 1:100) as in (E). In (A–F), measurements were normalized to the mean of Mapt+/+ samples treated with the scrambled siRNA on the same 96-well plate (defined as 1.0). Numbers in bars indicate biological replicates (independent cultures from individual mouse pups). *P < 0.05, **P < 0.01, ***P < 0.001, ****P < 0.0001 vs. the leftmost bar (A, C, E), genotype-matched neurons treated with scrambled siRNA (B), the leftmost bar in each siRNA block (D, F), or as indicated by brackets, determined by one-way ANOVA with Holm-Sidak test (A) or two-way ANOVA with Holm-Sidak test (B–F). By two- way ANOVA, interactions between genotype and siRNA (B): P = 0.94, F3, 64 = 0.14; genotype and treatment (C): P = 0.0019, F1, 32 = 11.44; siRNA and treatment (D): P = 0.29, F6, 96 = 1.24; genotype and treatment (E): P = 0.0013, F1, 32 = 12.52; and siRNA and treatment (F): P = 0.090, F6, 96 = 1.89. n.s., not significant. Values are means ± SEM.
Figure 7 |
Figure 7 |. Tau Reduction Does Not Prevent Autism-like Behaviors in Shank3B−/− Mice that Lack Epileptic Activity, Megalencephaly, and Overactivation of Akt and S6
(A–D) WT and Shank3B−/− mice on the Mapt+/+ background were compared at different ages. (A–B) Relative hippocampal pAkt/total Akt (A) and pS6 (Ser235/236)/total S6 (B) signal ratios determined by western blot analysis. Average measurements from WT samples on the same gel were defined as 1.0. (C) Epileptic spike numbers obtained by EEG recordings in resting mice. (D) Brain weights. (E–I) Male Shank3B+/+ and Shank3B−/− mice with 2, 1, or 0 Mapt alleles were assessed for autism- like behaviors at 8–11 months of age. (E) Self-grooming behavior measured as in Figure 1A. (F) Relearning test carried out as in Figure 1B. (G) Social interaction test. Time spent in the chamber with an enclosure containing a live mouse or the chamber with an empty enclosure was recorded for 10 minutes. Interaction between age and time by two-way ANOVA: P = 0.337, F5, 73 = 1.16. (H–I) Olfactory habituation/dishabituation test carried out as in Figure 1D–E. All groups of mice displayed similar habituation to water and vanilla; for habituation to social odor, Shank3B−/−Mapt+/+ mice differed from Shank3B+/+Mapt+/+ (P < 0.0001) and Shank3B+/+Mapt−/− (P < 0.0001) mice. All groups of mice displayed similar dishabituation from water to vanilla; for dishabituation from vanilla to social odor, Shank3B−/−Mapt+/+ mice differed from Shank3B+/+Mapt+/+ (P < 0.0001) and Shank3B+/+Mapt−/− (P < 0.0001) mice. Numbers in bars indicate numbers of mice per group. §P = 0.12, #P = 0.062, *P < 0.05, **P < 0.01, ***P < 0.001, ****P < 0.0001 vs. age-matched Shank3B+/+Mapt+/+ (WT) mice, or as indicated by brackets, determined by two-way ANOVA with Holm-Sidak test (A, B, D), Kruskal-Wallis test with Dunn test (C), multiple Welch’s t tests with Holm-Sidak test (E), one-way ANOVA with Holm-Sidak test (F, I), two-tailed paired t tests with Holm-Sidak correction (G), or GEE framework with Holm-Sidak test (H). By two- way ANOVA, interaction between age and pAkt (A): P = 0.60, F2, 26 = 0.51; between age and pS6 (B): P = 0.65, F2, 26 = 0.44; between age and brain weight (D): P = 0.55, F2, 95 = 0.61. n.s., not significant. NT: Shank3B+/+Mapt+/ mice were not tested in the experiments shown in (F, I). Values are means ± SEM.

Comment in

References

    1. Allen Institute for Brain Science. (2019). Allen Brain Atlas: Developing Mouse Brain. Available from: https://developingmouse.brain-map.org/gene/show/17529.
    1. Baio J., Wiggins L., Christensen DL., Maenner MJ., Daniels J., Warren Z., Kurzius-Spencer M., Zahorodny W., Robinson Rosenberg C., White T., et al. (2018). Prevalence of autism spectrum disorder among children aged 8 years—Autism and Developmental Disabilities Monitoring Network, 11 Sites, United States, 2014. MMWR Surveill Summ 67, 1–23. - PMC - PubMed
    1. Berkvens JJ, Veugen I, Veendrick-Meekes MJ, Snoeijen-Schouwenaars FM, Schelhaas HJ, Willemsen MH, Tan IY, and Aldenkamp AP (2015). Autism and behavior in adult patients with Dravet syndrome (DS). Epilepsy Behav 47, 11–16. - PubMed
    1. Bi M, Gladbach A, van Eersel J, Ittner A, Przybyla M, van Hummel A, Chua SW, van der Hoven J, Lee WS, Muller J, et al. (2017). Tau exacerbates excitotoxic brain damage in an animal model of stroke. Nat Commun 8, 473. - PMC - PubMed
    1. Bidinosti M, Botta P, Kruttner S, Proenca CC, Stoehr N, Bernhard M, Fruh I, Mueller M, Bonenfant D, Voshol H, et al. (2016). CLK2 inhibition ameliorates autistic features associated with SHANK3 deficiency. Science 351, 1199–1203. - PubMed

Publication types

MeSH terms