

CDK1 and CDC20 overexpression in patients with colorectal cancer are associated with poor prognosis: evidence from integrated bioinformatics analysis
- PMID: 32127012
- PMCID: PMC7055103
- DOI: 10.1186/s12957-020-01817-8
CDK1 and CDC20 overexpression in patients with colorectal cancer are associated with poor prognosis: evidence from integrated bioinformatics analysis
Abstract
Background: Colorectal cancer (CRC) is one of the most common malignancies of the digestive system, which causes severe financial burden worldwide. However, the specific mechanisms involved in CRC are still unclear.
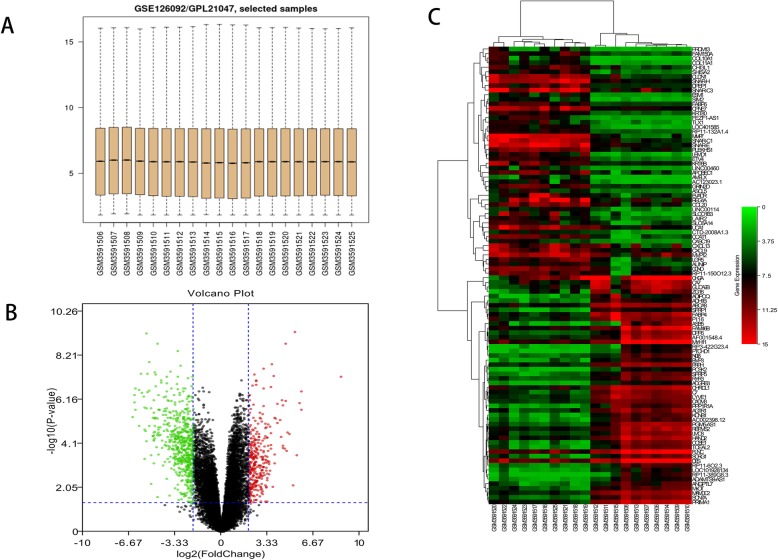
Methods: To identify the significant genes and pathways involved in the initiation and progression of CRC, the microarray dataset GSE126092 was downloaded from Gene Expression Omnibus (GEO) database, and then, the data was analyzed to identify differentially expressed genes (DEGs). Subsequently, the Gene Ontology (GO) annotation and Kyoto Encyclopedia of Genes and Genomes (KEGG) pathway analysis were performed on these DEGs using the DAVID database, and the protein-protein interaction (PPI) network was constructed using the STRING database and analyzed using the Cytoscape software. Finally, hub genes were screened, and the survival analysis was performed on these hub genes using the Kaplan-Meier curves in the cBioPortal database.
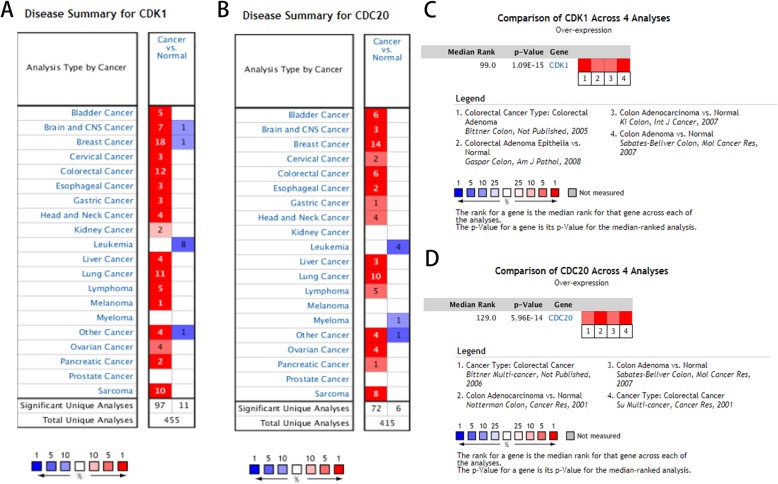
Results: In total, 937 DEGs were obtained, including 316 upregulated genes and 621 downregulated genes. GO analysis revealed that the DEGs were mostly enriched in terms of nuclear division, organelle fission, cell division, and cell cycle process. KEGG pathway analysis showed that the DEGs were mostly enriched in cell cycle, oocyte meiosis, cytokine-cytokine receptor interaction, and cGMP-PKG signaling pathway. The PPI network comprised 608 nodes and 3100 edges, and 4 significant modules and 10 hub genes with the highest degree were identified using the Cytoscape software. Finally, survival analysis showed that overexpression of CDK1 and CDC20 in patients with CRC were statistically associated with worse overall survival.
Conclusions: This bioinformatics analysis revealed that CDK1 and CDC20 might be candidate targets for diagnosis and treatment of CRC, which provided valuable clues for CRC.
Keywords: Bioinformatics analysis; Cell division cycle 20 homolog; Colorectal cancer; Cyclin-dependent kinase 1; Hub genes.
Conflict of interest statement
The authors declare that they have no competing interests.
Figures


References
MeSH terms
Substances
LinkOut - more resources
Full Text Sources
Medical
Miscellaneous
