. 2020 May 1;80(9):1819-1832.
doi: 10.1158/0008-5472.CAN-19-3116. Epub 2020 Mar 3.

Targeting the E3 Ubiquitin Ligase PJA1 Enhances Tumor-Suppressing TGFβ Signaling

Affiliations

Targeting the E3 Ubiquitin Ligase PJA1 Enhances Tumor-Suppressing TGFβ Signaling

Jian Chen et al. Cancer Res. .

Abstract

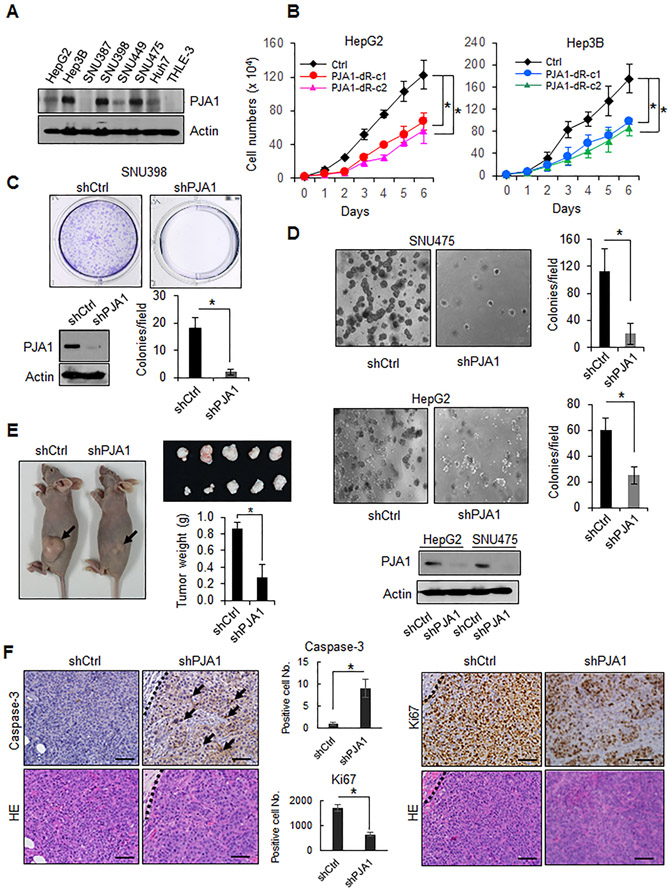
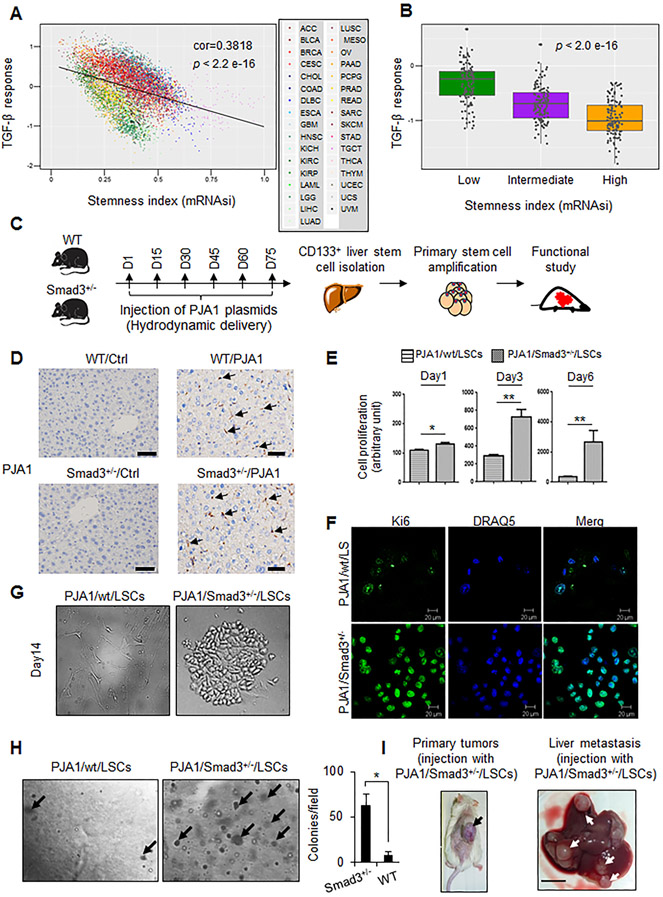
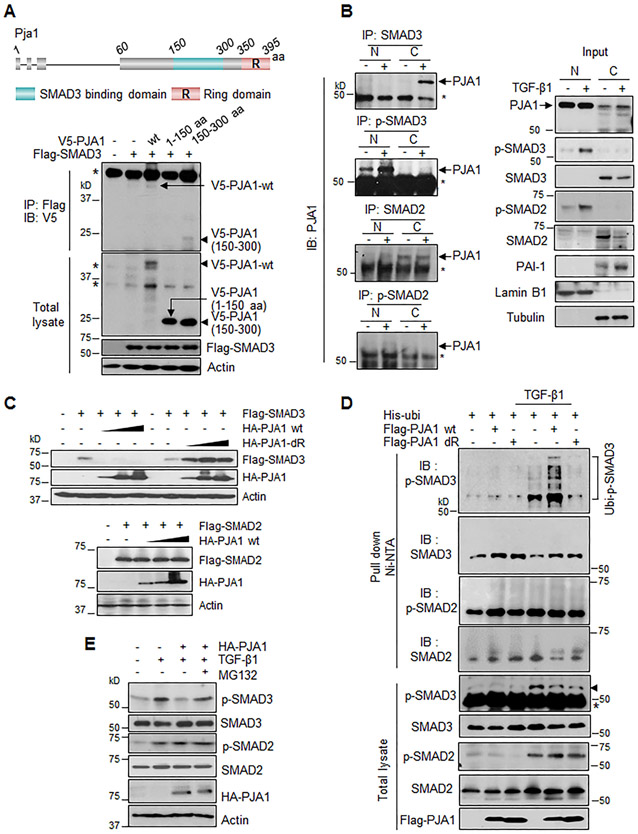
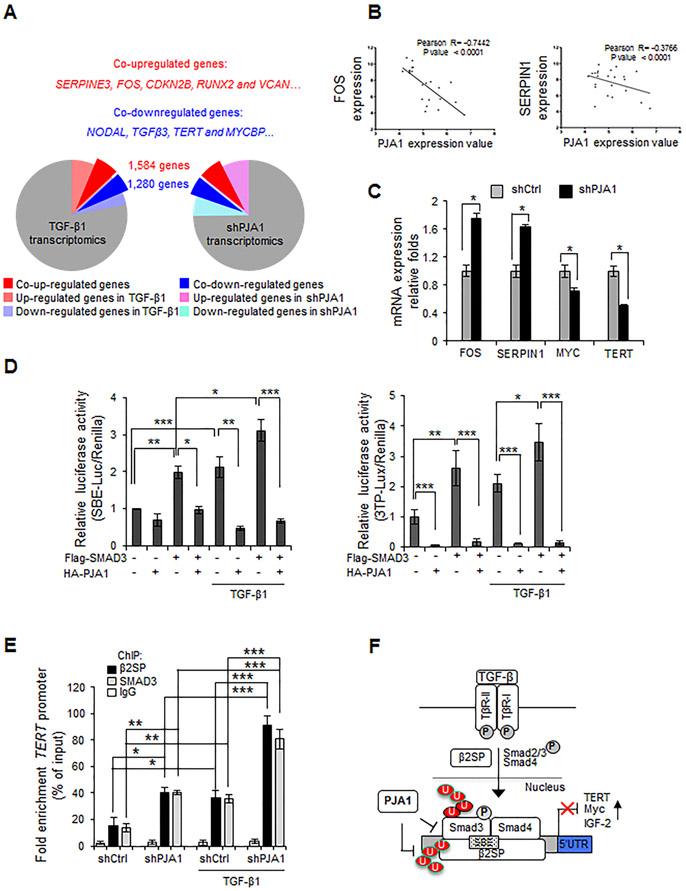
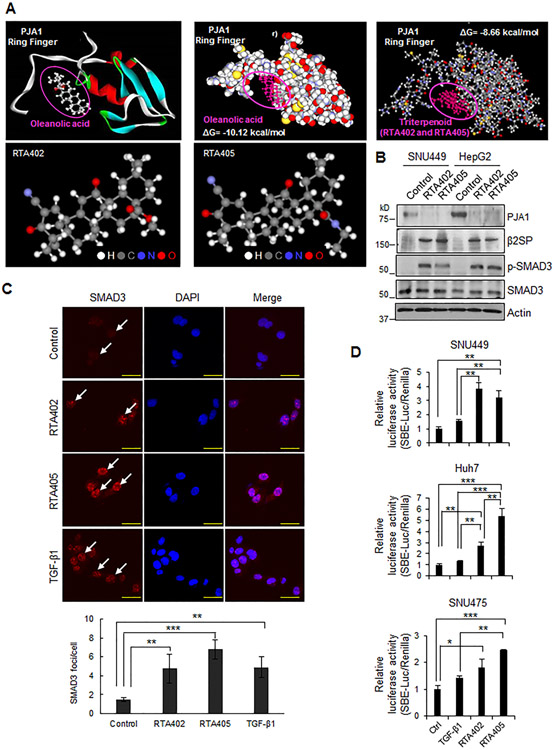
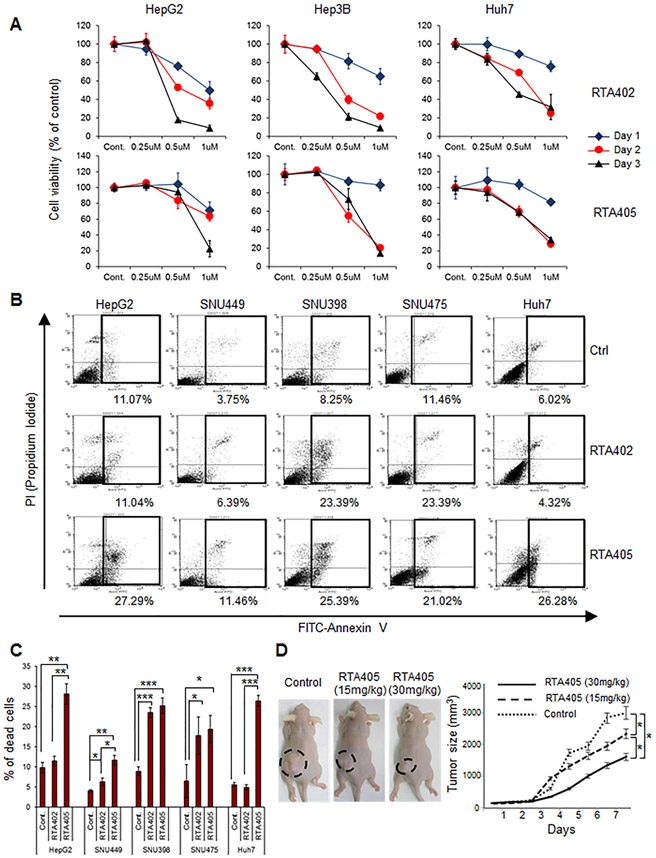
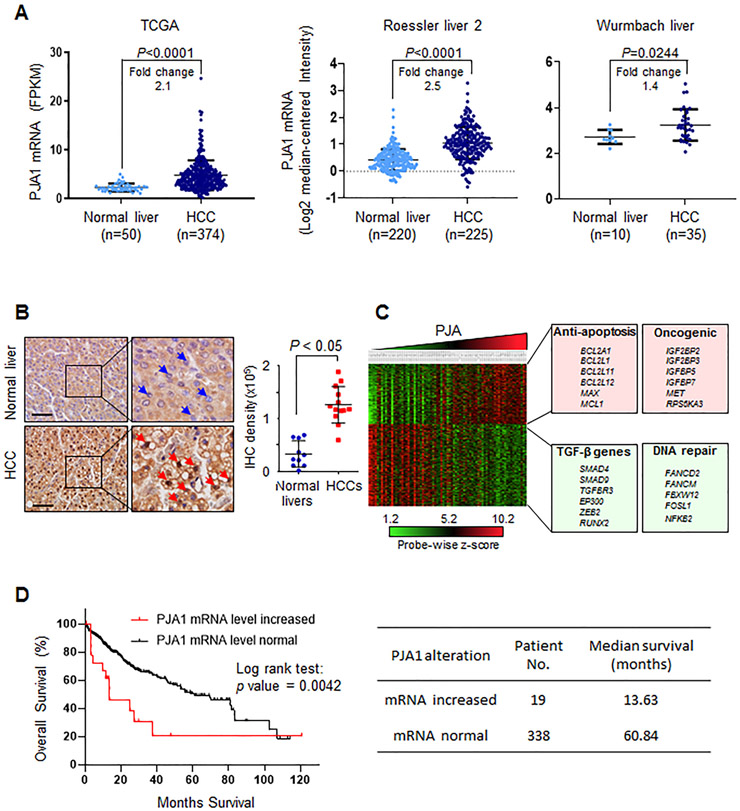
RING-finger E3 ligases are instrumental in the regulation of inflammatory cascades, apoptosis, and cancer. However, their roles are relatively unknown in TGFβ/SMAD signaling. SMAD3 and its adaptors, such as β2SP, are important mediators of TGFβ signaling and regulate gene expression to suppress stem cell-like phenotypes in diverse cancers, including hepatocellular carcinoma (HCC). Here, PJA1, an E3 ligase, promoted ubiquitination and degradation of phosphorylated SMAD3 and impaired a SMAD3/β2SP-dependent tumor-suppressing pathway in multiple HCC cell lines. In mice deficient for SMAD3 (Smad3 +/-), PJA1 overexpression promoted the transformation of liver stem cells. Analysis of genes regulated by PJA1 knockdown and TGFβ1 signaling revealed 1,584 co-upregulated genes and 1,280 co-downregulated genes, including many implicated in cancer. The E3 ligase inhibitor RTA405 enhanced SMAD3-regulated gene expression and reduced growth of HCC cells in culture and xenografts of HCC tumors, suggesting that inhibition of PJA1 may be beneficial in treating HCC or preventing HCC development in at-risk patients.Significance: These findings provide a novel mechanism regulating the tumor suppressor function of TGFβ in liver carcinogenesis.


Conflict of interest statement

The authors declare no potential conflicts of interest.

Figures

Figure 1.
Figure 1.
PJA1 functions as a tumor promoter. (A) Abundance of PJA1 in liver cancer cell lines and normal hepatocytes. Cell lysates from a panel of liver cancer cell lines and a normal hepatocyte cell line THLE-3 were used. (B) Proliferation of stable cell lines overexpressing RING domain-deleted PJA1. Two stable lines (dR-c1 and dR-c2) were generated.*: P-value < 0.05, one-way analysis of variance. (C) Effect of PJA1 knock down on colony formation of SNU398 cells. A representative image of a well for each shRNA (upper panel) and quantitative data (lower right graph) from three independent experiments are shown. The effect of shRNA on PJA1 protein levels is shown (lower left). (D) Effect of knockdown of PJA1 on anchorage-independent colony formation of SNU475 and HepG2 cells grown in soft agar. The effects of shRNA on PJA1 protein levels in HepG2 and SNU475 cells are shown (lower panel). (E) Effect of PJA1 knockdown in SNU475 cells on tumor growth when xenografted subcutaneously into nude mice. Mice were injected with SNU475-shCtrl (n = 5 mice) or SNU475-shPJA1 cells (n = 5 mice). Representative mice bearing xenografts from each group, photographs of the tumors, and quantitative analysis of tumor weight are shown. (F) Histology and immunohistochemistry of xenografts in nude mice. Quantification of immunohistochemistry staining is shown in the bar graphs. Scale bars indicates 100 μm. For B-E, data are presented as mean ± standard deviation, and each result shown is representative of three independent experiments. For C-F, statistical analysis was performed by two-tailed Student’s t- tests (*, P-value < 0.05).
Figure 2.
Figure 2.
PJA1 promotes liver stem cell (LSC) proliferation and liver metastasis in Smad3+/− mice. (A) Negative correlation between cancer stem cell signature and TGF-β response in TCGA pan-cancer samples (n=9660). Scatter plot shows the position of each cancer sample, color indicates tumor type (abbreviations according to Supplementary Fig. S2). Significance was determined by Pearson correlation. (B) Relationship between TGF-β response score in TCGA HCC cohort and stemness status. TCGA HCC samples (n=368) were stratified based on the stemness status, defined by ranking the samples by their RNA-based stemness index (mRNAsi) and dividing the samples in top, intermediate, and bottom thirds. Statistical differences among the groups was assessed by 1-way ANOVA. (C) Diagram of the paradigm for generation and isolation of LSCs and analysis of their potential to function as cancer stem cells. Timeline shows days of tail vein injection of wild-type (WT) (n = 6) and Smad3+/− (n = 6) mice with PJA1-encoding plasmid over a 75-day period (D1, day 1; D15, day 15, and so on). (D) Presence of PJA1 in mouse livers in WT and Smad3+/− mice with hydrodynamic tail vein PJA1 injections. Representative immunohistochemical staining images of PJA1 from WT or Smad3+/− mouse injected with PJA1-encoding plasmids or control plasmid DNA (empty pB513B) for 3 months were shown. Scale bars indicates 50 μm. (E) Proliferative potential of CD133+ cells isolated from PJA1-injected wild-type mice (PJA1/wt/LSCs) and PJA1-injected Smad3+/− mice (PJA1/Smad3+/−/LSCs). CD133+ LSCs were cultured in Liver Cell Medium on lysine/laminin-coated plates. *:P < 0.05; ** :P < 0.001, one-way analysis of variance. (F) Identification of proliferative LSCs by immunostaining of Ki67. Nuclei were labeled with DRAQ5. (G) Differences in growth behavior of PJA1/Smad3+/−/LSCs and PJA1/wt/LSCs. CD133+ LSCs from wild-type or Smad3+/− mice were plated on lysine/laminin-coated plates and grown in Liver Cell Medium. Representative images are from day 14 in culture are shown. (H) Growth of LSC colonies in soft agar. Cells were grown for 4 weeks, and colonies were counted from three experiments. *, P-value < 0.05, two-tailed Student’s t- test. (I) Tumor formation by PJA1/Smad3+/−/LSCs or PJA1/wt/LSCs. LSCs were injected subcutaneously into NOD SCID gamma chain knockout (NSG) mice (n = 6, per cell line). After 30 days, mice were sacrificed and evaluated for the formation of tumors at the site of injection and in the liver. Representative images from the 2 mice injected with PJA1/Smad3+/−/LSCs that developed tumors are shown. Scale bar indicates 5 mm. For E and H, quantitative data are presented as mean ± standard deviation.
Figure 3.
Figure 3.
PJA1 enhances ubiquitination and degradation of TGF-β-induced phospho-SMAD3. (A) Interaction of PJA1 with SMAD3. Top shows a diagram of the mouse PJA1 with the RING domain and SMAD3-binding domain indicated. HepG2 cells were cotransfected with the indicated plasmids. (B) Effect of TGF-β1 on the interaction between PJA1 and SMAD3 or SMAD2. HepG2 cells were exposed to 200 pM TGF-β1 for 1 hour (+), nuclear (N) and cytoplasmic (C) fractions were isolated. (C) Effect of overexpression of PJA1 on SMAD3 and SMAD2 abundance. HepG2 cells were cotransfected with HA-tagged wild-type PJA1 (HA-PJA1 wt) or HA-tagged PJA1 lacking the RING domain (HA-PJA1-dR) and Flag-tagged SMAD3 (upper panel), or cotransfected with HA-PJA1 wt and Flag-tagged SMAD2 (lower panel). (D) Effect of PJA1 on ubiquitination of SMAD3 and SMAD2. HepG2 cells were cotransfected with His-ubiquitin plus Flag-PJA1 wild-type or Flag-PJA1 RING domain-deletion mutant. Cells were exposed to 200 pM TGF-β1 for 1 hour. Ubiquitinated proteins were isolated with Ni-NTA-agarose beads. (E) Effect of proteasome inhibition on TGF-β-induced p-SMAD3 abundance. HepaG2 cells were transfected with HA-PJA1. Cells were treated with MG132 (50 μg/mL) for 6 hours with or without 200 pM TGF-β1 for 1 hour before harvest. For A, B and D, asterisk designates nonspecific bands.
Figure 4.
Figure 4.
PJA1 inhibits SMAD3 transcriptional activity. (A) Genes co-regulated by PJA1 and TGF-β1. RNAseq analyses of genes regulated by PJA1 knockdown or exposure to TGF-β1 in HepG2 cells. (B) Negative association between PJA1 mRNA expression and the TGF-β target gene, FOS and SERPIN1 in HCC patients. Wurmbach Liver and Mas Liver mRNA microarray datasets from Oncomine were downloaded and analyzed. Significance was determined by Pearson correlation. (C) The expression of TGF-β-regulated genes in PJA1 knockdown cells. Transcripts were quantified by quantitative RT-PCR from HepG2-shCtrl or HepG2-shPJA1 cells (Supplementary Materials and Methods). *: P < 0.05, two-tailed Student’s t- tests. (D) Effect of PJA1 on SMAD3-dependent reporter gene activity. HepG2 cells were cotransfected with the luciferase reporter constructs controlled by 4 copies of the SBE (SBEx4) (left panel) or 3TP (right panel) along with Flag-tagged SMAD3 and HA-tagged PJA1 as indicated. Where indicated, cells were exposed to 200 pM TGF-β1 for 1 hour. (E) Effect of PJA1 knockdown on binding of SMAD3 and β2SP at the TERT promoter. HepG2-shCtrl or HapG2-shPJA1cells were treated with 200 pM TGF-β1 for 1 hour. Chromatin immunoprecipitation (ChIP) analysis was performed with antibodies against the indicated proteins and the interaction with the TERT promoter was assessed. IgG served as a negative control (Supplementary Materials and Methods). For D and E*: P < 0.05, **: P < 0.01, ***: P < 0.001, 1-way ANOVA with post-hoc Bonferroni’s test. For C, D and E, data are shown as mean ± standard deviation of three independent experiments. (F) A model for the regulation of SMAD3 and β2SP by PJA1.
Figure 5.
Figure 5.
Triterpenoids RTA402 and RTA405 enhance TGF-β-SMAD3 signaling. (A) Computational molecular docking simulation analyses of oleanolic acid or triterpenoids to the PJA1 RING domain. Upper left shows the structures of oleanolic acid and the PJA1 ring finger domain. Upper middle shows the predicted interaction between oleanolic acid and PJA1 ring finger domain with the Gibbs free energy (ΔG). Upper right shows the predicted interaction between the synthetic triterpenoids and PJA1 RING domain with the ΔG of the interaction. Lower show the structures of RTA402 and RTA405. H: hydrogen, C: carbon, N: nitrogen, O: oxygen. (B) Effect of RTA402 and RTA405 on abundances of PJA1, β2SP and p-SMAD3 in HepG2 and SNU449 cells. Cells were exposed to RTA402 (0.25 μM) and RTA405 (0.25 μM) for 1 day. (C) Effect of RTA402 or RTA405 on SMAD3 nuclear translocation. HepG2 cells were treated with RTA402 (1 μM), RTA405 (1 μM), or TGF-β1 (200 pM) for 2 hours. Scale bar indicates 100 μm. Quantification of p-SMAD3 foci in nucleus is shown in the bar graph. (D) Effect of RTA402 and RTA405 on SMAD3-dependent reporter gene activity. The indicated cells were transfected with the SBEx4 luciferase reporter plasmids. After 24 hours of transfection, cells were treated with RTA402 (1 μM), RTA405 (1 μM), or TGF-β1 (200 pM) for 2 hours. For C and D, *: P < 0.05, **: P < 0.01, ***: P < 0.001, 1-way ANOVA with post-hoc Bonferroni’s test.
Figure 6.
Figure 6.
RTA402 and RTA405 induces apoptosis and inhibits growth of liver cancer cell lines in vitro and in vivo. (A) Effect of RTA402 or RTA405 on HCC cell viability in culture. The indicated cells were treated with the indicated concentrations of RTA402 or RTA405 for various times. (B) Induction of apoptosis in HCC cells exposed to RTA402 or RTA405. The indicated cells were treated with RTA402 (1 μM) or RTA405 (1 μM) for 2 hours. Representative results of FACS analysis for three independent experiments are shown. Percent apoptotic cells from the boxed areas are indicated beneath each FACS plot. (C) Quantitative data of FACS analysis in (B). Data are shown as mean ± standard deviation of three independent experiments. *: P < 0.05, **: P < 0.01, ***: P < 0.001, 1-way ANOVA with post-hoc Bonferroni’s test. (D) Effect of RTA405 on HCC tumor growth. Mice were subcutaneously injected with 5 × 10⁶ HepG2 cells and intraperitoneally injected with PBS (control), RTA405 (15 mg/kg), or RTA405 (30 mg/kg). Six mice were used for each treatment group. Error bars are shown as mean ± standard deviations. * P < 0.05, one-way analysis of variance.
Figure 7.
Figure 7.
PJA1 is a potential target for therapeutic intervention in HCC. (A) The abundance of PJA1 mRNA in HCC compared to that in normal liver tissue from three independent cancer datasets. Fold-change compares the difference in the mean. (B) Immunohistochemical staining for PJA1 abundance in normal liver (n = 10) and HCC (n = 13). Blue arrowheads point to negative PJA1 staining in cell nucleus; red arrowheads indicate positive PJA1 staining in cell nucleus. Magnification × 10; inset magnification × 40. Scale bar is 100 μm. For A and B, mean ± standard deviation is indicated. Statistical analysis was performed by two-tailed Student’s t- tests. (C) Transcriptomic analyses of HCC patient datasets from Gene Expression Omnibus (GSE9843, n = 91). Transcriptomic data was clustered into 4 quartiles according to PJA1 expression using Nexus Expression 3.0. Representative pathways and genes associated with high PJA1 expression are listed. Green-boxed genes are those with a negative correlation with PJA1 expression and red-boxed genes are those a positive correlation with PJA1 expression. (D) Overall survival analysis of TCGA HCC patient dataset. Overall survival according to increased or normal mRNA levels of PJA1 in HCC patients shows statistically significant differences (Log rank Test, P=0.0042) (left panel). Median survival of these two groups were listed on the right panel.

References

    1. International Agency for Research on Cancer: World Health Organization. GLOBOCAN 2014: Estimated Cancer Incidence, Mortality and Prevalence Worldwide in 2014. . Lyon, France: International Agency for Research on Cancer: World Health Organization; [updated 2014; cited 2014 March 27] 2014:Available from: http://globocan.iarc.fr/Pages/fact_sheets_population.aspx.
    1. Kulik L, El-Serag HB. Epidemiology and Management of Hepatocellular Carcinoma. Gastroenterology 2019;156:477–91 e1 - PMC - PubMed
    1. Marrero JA, Kulik LM, Sirlin CB, Zhu AX, Finn RS, Abecassis MM, et al. Diagnosis, Staging, and Management of Hepatocellular Carcinoma: 2018 Practice Guidance by the American Association for the Study of Liver Diseases. Hepatology 2018;68:723–50 - PubMed
    1. Llovet JM, Montal R, Sia D, Finn RS. Molecular therapies and precision medicine for hepatocellular carcinoma. Nat Rev Clin Oncol 2018;15:599–616 - PubMed
    1. Llovet JM, Zucman-Rossi J, Pikarsky E, Sangro B, Schwartz M, Sherman M, et al. Hepatocellular carcinoma. Nat Rev Dis Primers 2016;2:16018. - PubMed

Publication types

MeSH terms