. 2020 Mar 3;10(1):3926.
doi: 10.1038/s41598-020-60597-z.

Visuocortical tuning to a threat-related feature persists after extinction and consolidation of conditioned fear

Affiliations

Visuocortical tuning to a threat-related feature persists after extinction and consolidation of conditioned fear

Martin I Antov et al. Sci Rep. .

Abstract

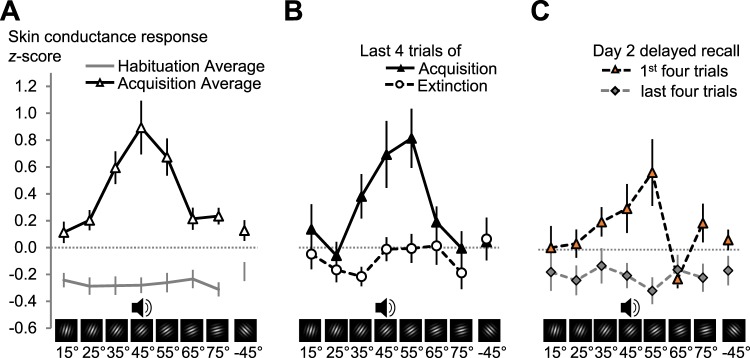
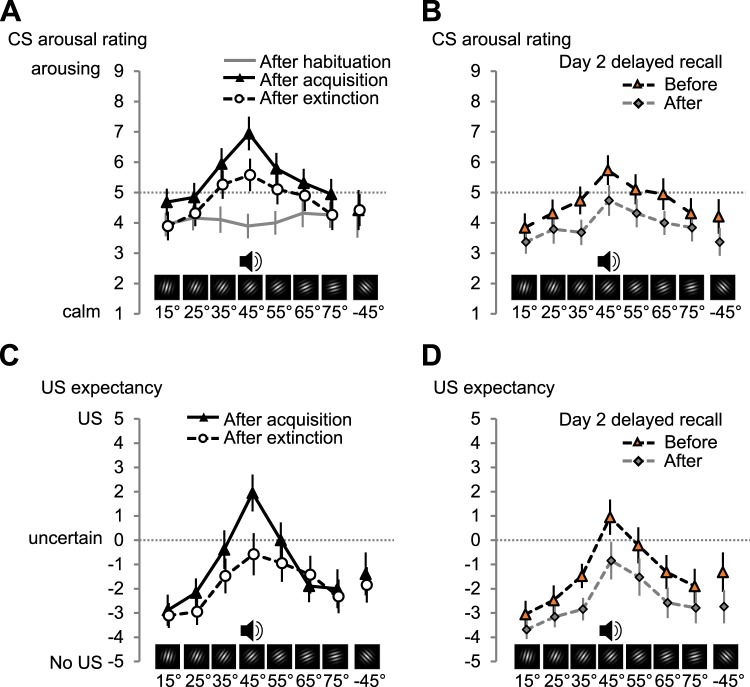
Neurons in the visual cortex sharpen their orientation tuning as humans learn aversive contingencies. A stimulus orientation (CS+) that reliably predicts an aversive noise (unconditioned stimulus: US) is selectively enhanced in lower-tier visual cortex, while similar unpaired orientations (CS-) are inhibited. Here, we examine in male volunteers how sharpened visual processing is affected by fear extinction learning (where no US is presented), and how fear and extinction memory undergo consolidation one day after the original learning episode. Using steady-state visually evoked potentials from electroencephalography in a fear generalization task, we found that extinction learning prompted rapid changes in orientation tuning: Both conditioned visuocortical and skin conductance responses to the CS+ were strongly reduced. Next-day re-testing (delayed recall) revealed a brief but precise return-of-tuning to the CS+ in visual cortex accompanied by a brief, more generalized return-of-fear in skin conductance. Explorative analyses also showed persistent tuning to the threat cue in higher visual areas, 24 h after successful extinction, outlasting peripheral responding. Together, experience-based changes in the sensitivity of visual neurons show response patterns consistent with memory consolidation and spontaneous recovery, the hallmarks of long-term neural plasticity.


Conflict of interest statement

The authors declare no competing interests.

Figures

Figure 1
Figure 1
Experimental procedure and steady-state evoked potential (ssVEP) time domain and topographical distribution. (A) Overview of the procedure and example stimuli used during the 4 phases of the experiment: Habituation, acquisition, extinction, and a 24-h delayed recall. During each learning phase participants (N = 19) passively viewed high-contrast grating stimuli with eight different orientations (16 trials for each orientation and learning phase). To evoke a steady-state brain response with a known frequency, each grating reversed phase 71 times per trial at a rate of 15 (N = 9) or 14.167 Hz (N = 10). This produces the visual impression of the grating jumping slightly from left to right at a steady pace. Only during the acquisition phase one of the gratings (the CS+) was paired with a 1-s, 98 dB (A) aversive white noise burst (unconditioned stimulus = US). (B) Evoked steady state visuocortical response. Left: Representative time domain signal from the middle occipital sensor (Oz) for the 15 Hz phase reversal of one grating orientation (45°), averaged over 16 habituation trials and N = 9 participants. Right: Scalp distribution of the frequency domain average of the 15 Hz ssVEP power for the same stimulus and participants.
Figure 2
Figure 2
Occipital cortical responses during the different phases of conditioning. (A) Changes in the grand average (N = 19) of visual electrocortical activity for each learning phase (habituation, acquisition, extinction, and day 2 delayed recall) and for each CS orientation. Regional means of the ssVEP spectral power current source density (CSD, Laplacian space), averaged across 3 occipital midline sensor locations (O1, Oz, O2), were used to estimate the occipital cortex surface potential. Values are signal-to-noise ratios (SNR), i.e., the power at the driving frequency was divided by the average power for the five frequency bins below and four frequency bins above the driving frequency (as the noise estimate). Supplementary Fig. S1 shows single subject data. (B) The same data after habituation correction for acquisition, extinction, and day 2 delayed recall. The insert shows a view of the back of the electrode array used, the sensor locations used for averaging are highlighted. Error bars show 1 standard error of the mean (SEM). Supplementary Fig. S2 shows single subject data. (C) Cortical regions responsive to fear conditioning: Topographical distributions (back views of the scalp) showing results (F-values with N = 19) of planned contrasts testing for lateral inhibition (top, black line, ‘Mexican hat’ contrast) versus fear generalization (bottom, blue line, quadratic contrast) of habituation-corrected electrocortical responses across orientations, averaged over all acquisition, extinction, and day 2 delayed recall trials. F-values exceeding ±4.41 indicate a reliable model fit. Fits matching the opposite pattern (i.e., inverted ‘Mexican hat’ or quadratic) are shown in blue. The numbers above the line-graphs on the left are the weights used for planned contrasts.
Figure 3
Figure 3
Trial-by-trial development of occipital orientation tuning and sympathetic skin conductance responses (SCR) during conditioning over two days. (A) Single-trial cortical responses, pooled across 3 occipital midline sensor locations (O1, Oz, O2). Top panel: color-coded single-trial amplitude of the occipital visual electrocortical response during habituation, acquisition, extinction, and day 2 delayed recall. The dynamic of learning and recall in the visual cortex is shown for the 8 CS orientations (shown on the y-axis) with the CS+ (45 degree orientation) in the middle. Bottom: model fits (F-values from planned contrasts) for the competing hypotheses of fear generalization (blue line) and lateral inhibition (black line, ‘Mexican hat’), calculated for each trial. The yellow line shows the ΔBIC(G-L) = BIC(Generalization) − BIC(Lateral inhibition), values >2 favour lateral inhibition, values <−2 favour generalization. Note: Contour plots show no error estimates, see Supplementary Fig. S5 for an alternative depiction. (B) Single-trial SCR. Top: As in (A) but for average color-coded single-trial amplitude of the SCRs. Bottom: model fits (planned contrasts) for fear generalization (blue line) and lateral inhibition (black line). The yellow line shows the ΔBIC(L-G), as we expected generalization for SCR, here values >2 favour generalization, values <−2 favour lateral inhibition. In both panels: where the data fit an inverted quadratic or ‘Mexican hat’ contrast, the F-values were given a negative sign to denote the inverted fit.
Figure 4
Figure 4
Conditioned tuning over lateral temporo-occipital cortex in single-trial data. (A) Topographical distributions (left and right views of the scalp) showing results (F-values) of contrasts testing for lateral inhibition (‘Mexican hat’) for habituation-corrected electrocortical responses across orientations, for trials 5–12 of day 2 delayed recall. The 4 sensors selected for analyses are highlighted white. Fits matching the opposite pattern (i.e., inverted ‘Mexican hat’) are shown in blue. (B) Trial-by-trial development of orientation tuning during conditioning. Top: color-coded single-trial amplitude of the exploratory 4-sensor cluster from the bilateral temporo-occipital region (TP8, TP10, TP7, and TP9), shown for the 7 CS orientations (on the y-axis) with the CS+ (45° orientation) in the middle. Bottom: model fits (planned contrasts, F-values) for generalization (blue line) and lateral inhibition (black line, ‘Mexican hat’), calculated for each trial. The yellow line shows the ΔBIC(G-L) = BIC(Generalization) − BIC(Lateral inhibition), values >2 favour lateral inhibition, values <−2 favour generalization. Where the data fit an inverted quadratic or ‘Mexican hat’ function, the F-values were given a negative sign to denote the inverted fit. Note: Contour plots show no error estimates, see Supplementary Fig. S5 for an alternative depiction. For completeness, Supplementary Fig. S9 shows 16-trial averages of these 4 sensors, as in Fig. 2A,B.
Figure 5
Figure 5
Skin conductance responses during the different phases of fear conditioning. (A) Mean (N = 19) skin conductance responses averaged over all 16 trials of habituation and acquisition on day 1. (B) Shows the means for the last four trials of acquisition and extinction on day 1, respectively. (C) The first and last four trials of the delayed recall phase on day 2. In all plots the data are averaged over individual z-scores, standardized on the mean and SD of all CS responses of a subject in the experiment. Error bars show ± 1 SEM. Supplementary Fig. S6 shows single subject SCR data.
Figure 6
Figure 6
Subjective self-report changes in CS arousal and US expectancy during the different phases of fear conditioning. Mean (N = 19) arousal rating for each CS orientation as rated (A) after habituation, acquisition, and extinction on day 1 and (B) before and after delayed recall on day 2. US expectancy mean (N = 18) as rated (C) after habituation, acquisition, and extinction on day 1 and (D) before and after delayed recall on day 2. Error bars show ±1 SEM. Supplementary Figs. S7 and S8 show single subject data for arousal and US expectancy ratings.

Similar articles

Cited by

References

    1. Pavlov, I. P. Conditioned reflexes: an investigation of the physiological activity of the cerebral cortex. (Oxford University Press, 1927). - PMC - PubMed
    1. Myers KM, Davis M. Mechanisms of fear extinction. Mol. Psychiatry. 2007;12:120–150. doi: 10.1038/sj.mp.4001939. - DOI - PubMed
    1. Furini C, Myskiw J, Izquierdo I. The learning of fear extinction. Neurosci. Biobehav. Rev. 2014;47:670–683. doi: 10.1016/j.neubiorev.2014.10.016. - DOI - PubMed
    1. Herry C, Johansen J. Encoding of fear learning and memory in distributed neuronal circuits. Nat. Neurosci. 2014;17:1644–1654. doi: 10.1038/nn.3869. - DOI - PubMed
    1. McGann JP. Associative learning and sensory neuroplasticity: how does it happen and what is it good for? Learn. Mem. 2015;22:567–76. doi: 10.1101/lm.039636.115. - DOI - PMC - PubMed

Publication types