

Development of genetic quality tests for good manufacturing practice-compliant induced pluripotent stem cells and their derivatives
- PMID: 32127560
- PMCID: PMC7054319
- DOI: 10.1038/s41598-020-60466-9
Development of genetic quality tests for good manufacturing practice-compliant induced pluripotent stem cells and their derivatives
Abstract
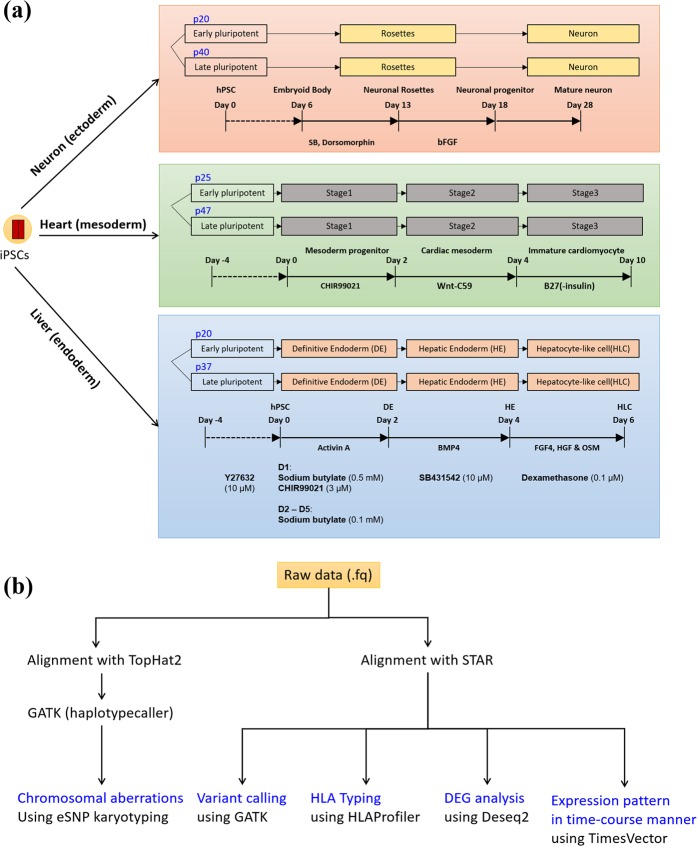
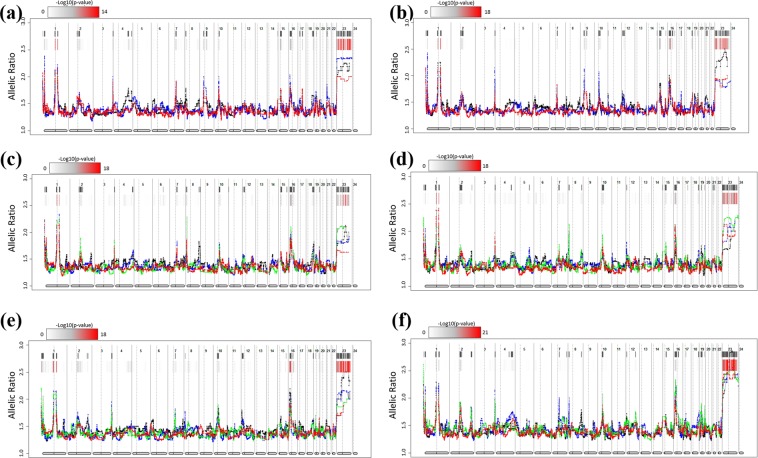
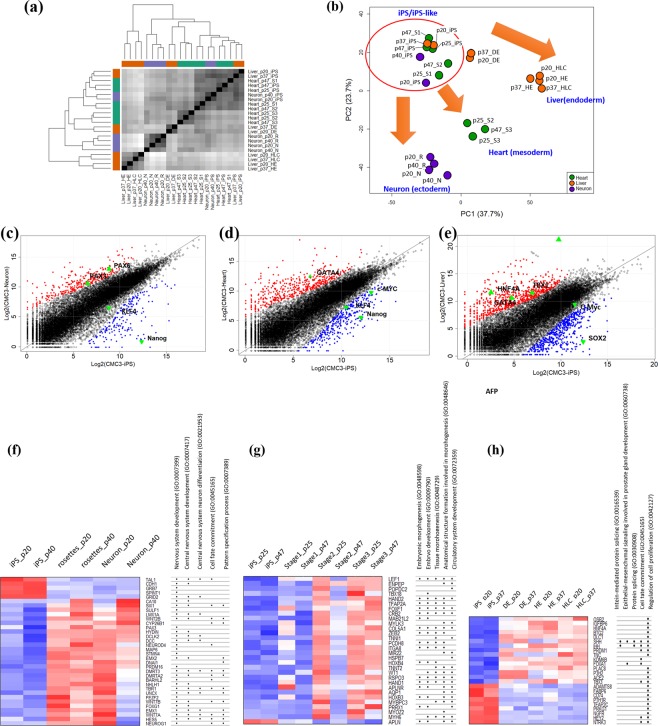
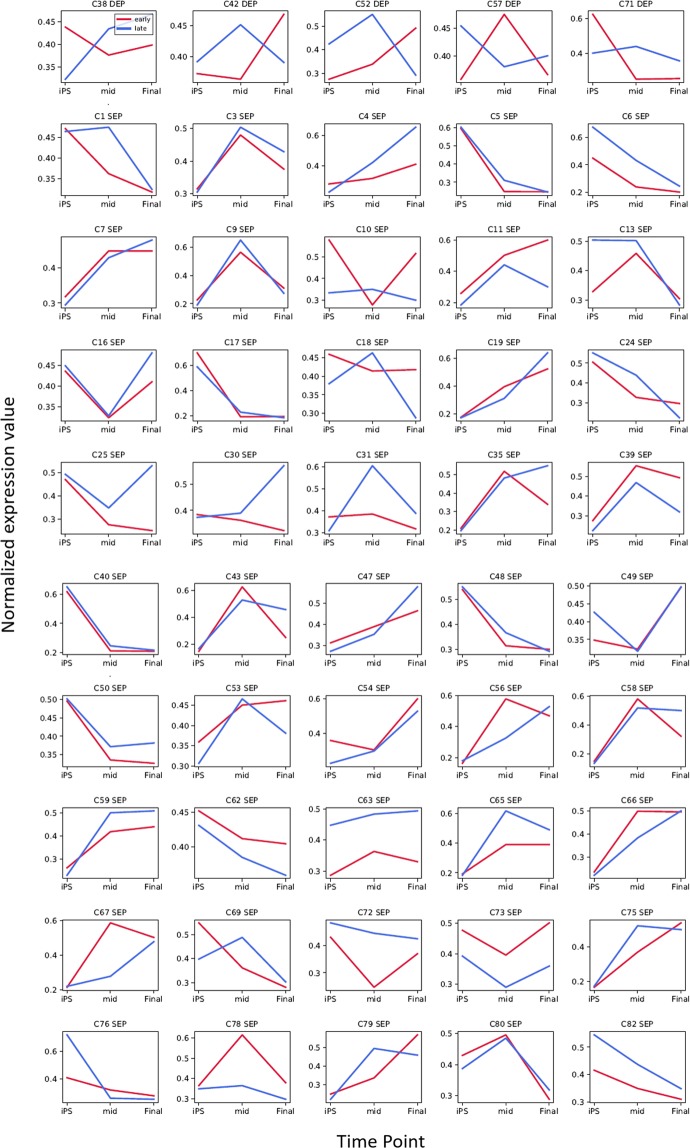
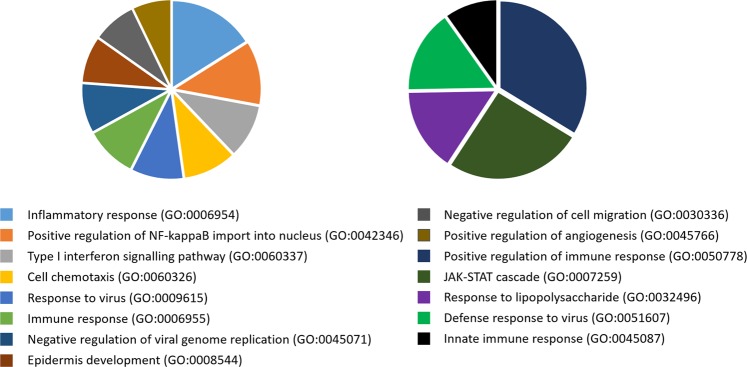
Although human induced pluripotent stem cell (hiPSC) lines are karyotypically normal, they retain the potential for mutation in the genome. Accordingly, intensive and relevant quality controls for clinical-grade hiPSCs remain imperative. As a conceptual approach, we performed RNA-seq-based broad-range genetic quality tests on GMP-compliant human leucocyte antigen (HLA)-homozygous hiPSCs and their derivatives under postdistribution conditions to investigate whether sequencing data could provide a basis for future quality control. We found differences in the degree of single-nucleotide polymorphism (SNP) occurring in cells cultured at three collaborating institutes. However, the cells cultured at each centre showed similar trends, in which more SNPs occurred in late-passage hiPSCs than in early-passage hiPSCs after differentiation. In eSNP karyotyping analysis, none of the predicted copy number variations (CNVs) were identified, which confirmed the results of SNP chip-based CNV analysis. HLA genotyping analysis revealed that each cell line was homozygous for HLA-A, HLA-B, and DRB1 and heterozygous for HLA-DPB type. Gene expression profiling showed a similar differentiation ability of early- and late-passage hiPSCs into cardiomyocyte-like, hepatic-like, and neuronal cell types. However, time-course analysis identified five clusters showing different patterns of gene expression, which were mainly related to the immune response. In conclusion, RNA-seq analysis appears to offer an informative genetic quality testing approach for such cell types and allows the early screening of candidate hiPSC seed stocks for clinical use by facilitating safety and potential risk evaluation.
Conflict of interest statement
The authors declare no competing interests.
Figures
Similar articles
-
Generation of clinical-grade human induced pluripotent stem cells in Xeno-free conditions.Stem Cell Res Ther. 2015 Nov 12;6:223. doi: 10.1186/s13287-015-0206-y. Stem Cell Res Ther. 2015. PMID: 26564165 Free PMC article.
-
Human induced pluripotent stem cells from two azoospermic patients with Klinefelter syndrome show similar X chromosome inactivation behavior to female pluripotent stem cells.Hum Reprod. 2019 Nov 1;34(11):2297-2310. doi: 10.1093/humrep/dez134. Hum Reprod. 2019. PMID: 31743397 Free PMC article.
-
Good Manufacturing Practice-compliant human induced pluripotent stem cells: from bench to putative clinical products.Cytotherapy. 2024 Jun;26(6):556-566. doi: 10.1016/j.jcyt.2024.02.021. Epub 2024 Mar 5. Cytotherapy. 2024. PMID: 38483359
-
Concise review: Genomic stability of human induced pluripotent stem cells.Stem Cells. 2012 Jan;30(1):22-7. doi: 10.1002/stem.705. Stem Cells. 2012. PMID: 21823210 Review.
-
DNA methylation dynamics in human induced pluripotent stem cells.Hum Cell. 2016 Jul;29(3):97-100. doi: 10.1007/s13577-016-0139-5. Epub 2016 Apr 15. Hum Cell. 2016. PMID: 27083573 Review.
Cited by
-
Wnt-activating human skin organoid model of atopic dermatitis induced by Staphylococcus aureus and its protective effects by Cutibacterium acnes.iScience. 2022 Sep 16;25(10):105150. doi: 10.1016/j.isci.2022.105150. eCollection 2022 Oct 21. iScience. 2022. PMID: 36193049 Free PMC article.
-
Engineering the next generation of allogeneic CAR cells: iPSCs as a scalable and editable platform.Stem Cell Reports. 2025 Jul 8;20(7):102515. doi: 10.1016/j.stemcr.2025.102515. Epub 2025 Jun 5. Stem Cell Reports. 2025. PMID: 40480218 Free PMC article. Review.
-
Non-human primate pluripotent stem cells for the preclinical testing of regenerative therapies.Neural Regen Res. 2022 Sep;17(9):1867-1874. doi: 10.4103/1673-5374.335689. Neural Regen Res. 2022. PMID: 35142660 Free PMC article. Review.
-
A Review of the Evidence for Tryptophan and the Kynurenine Pathway as a Regulator of Stem Cell Niches in Health and Disease.Int J Tryptophan Res. 2024 May 15;17:11786469241248287. doi: 10.1177/11786469241248287. eCollection 2024. Int J Tryptophan Res. 2024. PMID: 38757094 Free PMC article. Review.
-
Transcriptomic Profiling of iPS Cell-Derived Hepatocyte-like Cells Reveals Their Close Similarity to Primary Liver Hepatocytes.Cells. 2025 Jun 18;14(12):925. doi: 10.3390/cells14120925. Cells. 2025. PMID: 40558550 Free PMC article.
References
Publication types
MeSH terms
LinkOut - more resources
Full Text Sources
Molecular Biology Databases
Research Materials
