. 2020 Mar 3;10(1):3881.
doi: 10.1038/s41598-020-60803-y.

Expanded inverted repeat region with large scale inversion in the first complete plastid genome sequence of Plantago ovata

Affiliations

Expanded inverted repeat region with large scale inversion in the first complete plastid genome sequence of Plantago ovata

Sajjad Asaf et al. Sci Rep. .

Abstract

Plantago ovata (Plantaginaceae) is an economically and medicinally important species, however, least is known about its genomics and evolution. Here, we report the first complete plastome genome of P. ovata and comparison with previously published genomes of related species from Plantaginaceae. The results revealed that P. ovata plastome size was 162,116 bp and that it had typical quadripartite structure containing a large single copy region of 82,084 bp and small single copy region of 5,272 bp. The genome has a markedly higher inverted repeat (IR) size of 37.4 kb, suggesting large-scale inversion of 13.8 kb within the expanded IR regions. In addition, the P. ovata plastome contains 149 different genes, including 43 tRNA, 8 rRNA, and 98 protein-coding genes. The analysis revealed 139 microsatellites, of which 71 were in the non-coding regions. Approximately 32 forward, 34 tandem, and 17 palindromic repeats were detected. The complete genome sequences, 72 shared genes, matK gene, and rbcL gene from related species generated the same phylogenetic signals, and phylogenetic analysis revealed that P. ovata formed a single clade with P. maritima and P. media. The divergence time estimation as employed in BEAST revealed that P. ovata diverged from P. maritima and P. media about 11.0 million years ago (Mya; 95% highest posterior density, 10.06-12.25 Mya). In conclusion, P. ovata had significant variation in the IR region, suggesting a more stable P. ovata plastome genome than that of other Plantaginaceae species.


Conflict of interest statement

The authors declare no competing interests.

Figures
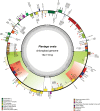
Figure 1
Figure 1
Gene map of the P. ovata plastome genome. Genes drawn inside the circle are transcribed clockwise, and those outside the circle are transcribed counterclockwise. The red and green colour asterisks indicate intron-containing and trans-spliced genes respectively. Genes belonging to different functional groups are colour-coded. The darker grey in the inner circle corresponds to GC content, and the lighter grey corresponds to AT content.
Figure 2
Figure 2
Alignment visualization of the P. ovata plastome genome sequences. VISTA-based identity plot showing sequence identity among the seven-species using P. ovata as a reference. The vertical scale indicates percent identity, ranging from 50% to 100%. The horizontal axis indicates the coordinates within the chloroplast genome. Arrows indicate the annotated genes and their transcription direction. The thick black lines show the inverted repeats (IRs).
Figure 3
Figure 3
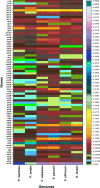
Pairwise sequence distance of P. ovata, 72 genes with related species.
Figure 4
Figure 4
Analysis of simple sequence repeats (SSR) in the seven Plantaginaceae plastomes; (A) SSR numbers detected in the seven species; (B) Frequency of identified SSR motifs in different repeat class types; (C) Frequency of identified SSRs in coding, Non-coding, rRNA and tRNA regions; (D) Frequency of identified SSRs in LSC, SSC and IR regions.
Figure 5
Figure 5
Analysis of repeated sequences in the seven Plantaginaceae plastomes. (A) Totals numbers of three repeat types; (B) Number of palindromic repeats by length; (C) Number of tandem repeats by length; (D) Number of forward repeats by length.
Figure 6
Figure 6
Comparison of border distance between adjacent genes and junctions of the LSC, SSC, and two IR regions among the plastome genomes of P. ovata and its relatives. Boxes above or below the main line indicate the adjacent border genes. The figure is not to scale with respect to sequence length and only shows relative changes at or near the IR/LSC or IR/SSC borders.
Figure 7
Figure 7
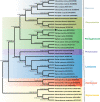
Phylogenetic trees were constructed for thirty-five species from eight families representing 22 genera using different methods, and tree is shown for the whole genome sequence data sets constructed by ML method. The whole genome sequence data set was used with four different methods, Bayesian inference (BI), maximum likelihood (ML), maximum persimony (MP) and neighbour-jouining (NJ). Numbers above the branches are the posterior probabilities of BI and bootstrap values of ML, MP and NJ respectively. Black dots represent the position for P. ovata.

References

    1. Gray MW. The evolutionary origins of organelles. Trends in Genetics. 1989;5:294–299. doi: 10.1016/0168-9525(89)90111-X. - DOI - PubMed
    1. Poczai P, Hyvönen J. The complete chloroplast genome sequence of the CAM epiphyte Spanish moss (Tillandsia usneoides, Bromeliaceae) and its comparative analysis. PloS one. 2017;12:e0187199. doi: 10.1371/journal.pone.0187199. - DOI - PMC - PubMed
    1. Palmer JD. Plastid chromosomes: structure and evolution. The molecular biology of plastids. 1991;7:5–53. doi: 10.1016/B978-0-12-715007-9.50009-8. - DOI
    1. Henry, R. J. Plant diversity and evolution: genotypic and phenotypic variation in higher plants. (Cabi Publishing, 2005).
    1. Lee H-L, Jansen RK, Chumley TW, Kim K-J. Gene relocations within chloroplast genomes of Jasminum and Menodora (Oleaceae) are due to multiple, overlapping inversions. Molecular Biology and Evolution. 2007;24:1161–1180. doi: 10.1093/molbev/msm036. - DOI - PubMed

Publication types