

Glycosylation of immunoglobulin G is regulated by a large network of genes pleiotropic with inflammatory diseases
- PMID: 32128391
- PMCID: PMC7030929
- DOI: 10.1126/sciadv.aax0301
Glycosylation of immunoglobulin G is regulated by a large network of genes pleiotropic with inflammatory diseases
Abstract
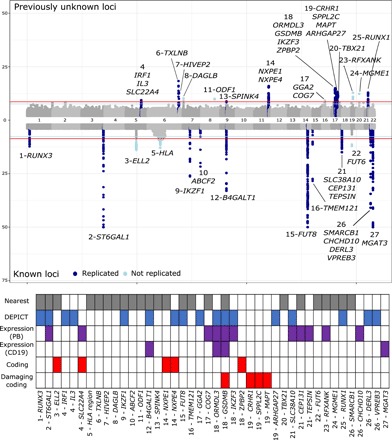
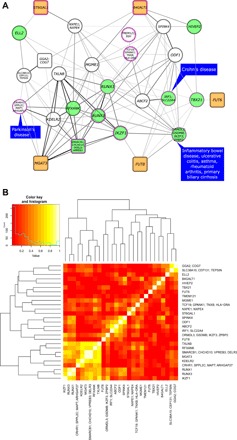
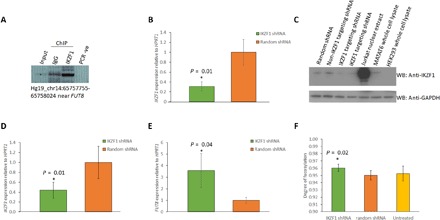
Effector functions of immunoglobulin G (IgG) are regulated by the composition of a glycan moiety, thus affecting activity of the immune system. Aberrant glycosylation of IgG has been observed in many diseases, but little is understood about the underlying mechanisms. We performed a genome-wide association study of IgG N-glycosylation (N = 8090) and, using a data-driven network approach, suggested how associated loci form a functional network. We confirmed in vitro that knockdown of IKZF1 decreases the expression of fucosyltransferase FUT8, resulting in increased levels of fucosylated glycans, and suggest that RUNX1 and RUNX3, together with SMARCB1, regulate expression of glycosyltransferase MGAT3. We also show that variants affecting the expression of genes involved in the regulation of glycoenzymes colocalize with variants affecting risk for inflammatory diseases. This study provides new evidence that variation in key transcription factors coupled with regulatory variation in glycogenes modifies IgG glycosylation and has influence on inflammatory diseases.
Copyright © 2020 The Authors, some rights reserved; exclusive licensee American Association for the Advancement of Science. No claim to original U.S. Government Works. Distributed under a Creative Commons Attribution License 4.0 (CC BY).
Figures
References
-
- Dalziel M., Crispin M., Scanlan C. N., Zitzmann N., Dwek R. A., Emerging principles for the therapeutic exploitation of glycosylation. Science 343, 1235681 (2014). - PubMed
-
- Gudelj I., Lauc G., Pezer M., Immunoglobulin G glycosylation in aging and diseases. Cell. Immunol. 333, 65–79 (2018). - PubMed
-
- N. Taniguchi, K. Honke, M. Fukuda, Handbook of Glycosyltransferases and Related Genes (Springer Science & Business Media, 2011).
-
- Huffman J. E., Knežević A., Vitart V., Kattla J., Adamczyk B., Novokmet M., Igl W., Pučić M., Zgaga L., Johannson Å., Redžić I., Gornik O., Zemunik T., Polašek O., Kolčić I., Pehlić M., Koeleman C. A. M., Campbell S., Wild S. H., Hastie N. D., Campbell H., Gyllensten U., Wuhrer M., Wilson J. F., Hayward C., Rudan I., Rudd P. M., Wright A. F., Lauc G., Polymorphisms in B3GAT1, SLC9A9 and MGAT5 are associated with variation within the human plasma N-glycome of 3533 European adults. Hum. Mol. Genet. 20, 5000–5011 (2011). - PubMed
Publication types
MeSH terms
Substances
Grants and funding
- MC_PC_U127527198/MRC_/Medical Research Council/United Kingdom
- ETM/47/CSO_/Chief Scientist Office/United Kingdom
- MC_U127527198/MRC_/Medical Research Council/United Kingdom
- MR/K018647/1/MRC_/Medical Research Council/United Kingdom
- 18927/CRUK_/Cancer Research UK/United Kingdom
- G0600237/MRC_/Medical Research Council/United Kingdom
- G0600329/MRC_/Medical Research Council/United Kingdom
- MC_UU_00007/10/MRC_/Medical Research Council/United Kingdom
- MC_UU_00007/1/MRC_/Medical Research Council/United Kingdom
- CZB/4/710/CSO_/Chief Scientist Office/United Kingdom
- 12076/CRUK_/Cancer Research UK/United Kingdom
- MR/R026408/1/MRC_/Medical Research Council/United Kingdom
LinkOut - more resources
Full Text Sources
