

Phenotypic plasticity of carbon fixation stimulates cyanobacterial blooms at elevated CO2
- PMID: 32128392
- PMCID: PMC7030920
- DOI: 10.1126/sciadv.aax2926
Phenotypic plasticity of carbon fixation stimulates cyanobacterial blooms at elevated CO2
Abstract
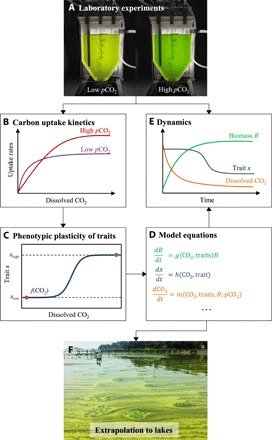
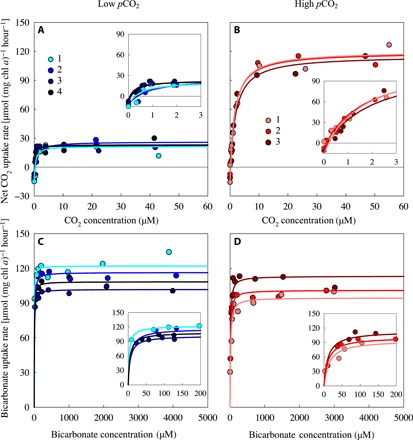
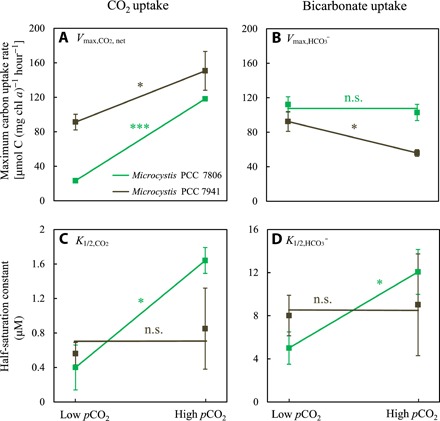
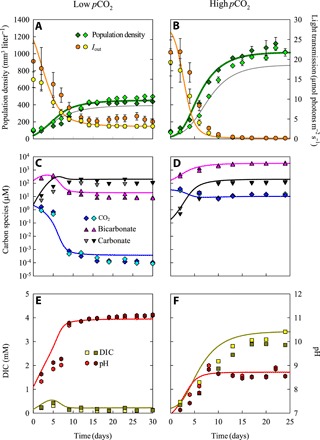
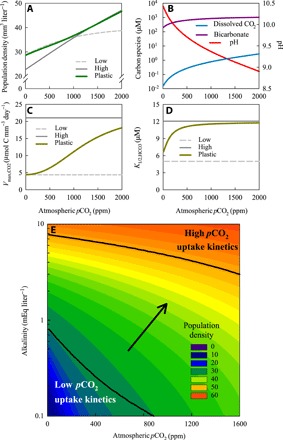
Although phenotypic plasticity is a widespread phenomenon, its implications for species responses to climate change are not well understood. For example, toxic cyanobacteria can form dense surface blooms threatening water quality in many eutrophic lakes, yet a theoretical framework to predict how phenotypic plasticity affects bloom development at elevated pCO2 is still lacking. We measured phenotypic plasticity of the carbon fixation rates of the common bloom-forming cyanobacterium Microcystis. Our results revealed a 1.8- to 5-fold increase in the maximum CO2 uptake rate of Microcystis at elevated pCO2, which exceeds CO2 responses reported for other phytoplankton species. The observed plasticity was incorporated into a mathematical model to predict dynamic changes in cyanobacterial abundance. The model was successfully validated by laboratory experiments and predicts that acclimation to high pCO2 will intensify Microcystis blooms in eutrophic lakes. These results indicate that this harmful cyanobacterium is likely to benefit strongly from rising atmospheric pCO2.
Copyright © 2020 The Authors, some rights reserved; exclusive licensee American Association for the Advancement of Science. No claim to original U.S. Government Works. Distributed under a Creative Commons Attribution NonCommercial License 4.0 (CC BY-NC).
Figures
Similar articles
-
How rising CO2 and global warming may stimulate harmful cyanobacterial blooms.Harmful Algae. 2016 Apr;54:145-159. doi: 10.1016/j.hal.2015.12.006. Harmful Algae. 2016. PMID: 28073473 Review.
-
Rising CO2 levels will intensify phytoplankton blooms in eutrophic and hypertrophic lakes.PLoS One. 2014 Aug 13;9(8):e104325. doi: 10.1371/journal.pone.0104325. eCollection 2014. PLoS One. 2014. PMID: 25119996 Free PMC article.
-
Rapid adaptation of harmful cyanobacteria to rising CO2.Proc Natl Acad Sci U S A. 2016 Aug 16;113(33):9315-20. doi: 10.1073/pnas.1602435113. Epub 2016 Aug 1. Proc Natl Acad Sci U S A. 2016. PMID: 27482094 Free PMC article.
-
Rising atmospheric CO2 levels result in an earlier cyanobacterial bloom-maintenance phase with higher algal biomass.Water Res. 2020 Oct 15;185:116267. doi: 10.1016/j.watres.2020.116267. Epub 2020 Aug 4. Water Res. 2020. PMID: 32798892
-
Effects of rising atmospheric CO2 levels on physiological response of cyanobacteria and cyanobacterial bloom development: A review.Sci Total Environ. 2021 Feb 1;754:141889. doi: 10.1016/j.scitotenv.2020.141889. Epub 2020 Aug 21. Sci Total Environ. 2021. PMID: 32920383 Review.
Cited by
-
6PPD-quinone affects the photosynthetic carbon fixation in cyanobacteria by extracting photosynthetic electrons.Innovation (Camb). 2024 Apr 26;5(4):100630. doi: 10.1016/j.xinn.2024.100630. eCollection 2024 Jul 1. Innovation (Camb). 2024. PMID: 38800352 Free PMC article.
-
Nature-Based Solution to Eliminate Cyanotoxins in Water Using Biologically Enhanced Biochar.Environ Sci Technol. 2023 Oct 31;57(43):16372-16385. doi: 10.1021/acs.est.3c05298. Epub 2023 Oct 19. Environ Sci Technol. 2023. PMID: 37856890 Free PMC article.
-
The Complicated and Confusing Ecology of Microcystis Blooms.mBio. 2020 Jun 30;11(3):e00529-20. doi: 10.1128/mBio.00529-20. mBio. 2020. PMID: 32605981 Free PMC article.
-
Disentangling the lifestyle of bacterial communities in tropical soda lakes.Sci Rep. 2022 May 13;12(1):7939. doi: 10.1038/s41598-022-12046-2. Sci Rep. 2022. PMID: 35562544 Free PMC article.
-
Atomic view of photosynthetic metabolite permeability pathways and confinement in synthetic carboxysome shells.Proc Natl Acad Sci U S A. 2024 Nov 5;121(45):e2402277121. doi: 10.1073/pnas.2402277121. Epub 2024 Nov 1. Proc Natl Acad Sci U S A. 2024. PMID: 39485798 Free PMC article.
References
-
- Charmantier A., McCleery R. H., Cole L. R., Perrins C., Kruuk L. E., Sheldon B. C., Adaptive phenotypic plasticity in response to climate change in a wild bird population. Science 320, 800–803 (2008). - PubMed
-
- Chevin L.-M., Collins S., Lefèvre F., Phenotypic plasticity and evolutionary demographic responses to climate change: taking theory out to the field. Funct. Ecol. 27, 967–979 (2013).
-
- Vargas C. A., Lagos N. A., Lardies M. A., Duarte C., Manríquez P. H., Aguilera V. M., Broitman B., Widdicombe S., Dupont S., Species-specific responses to ocean acidification should account for local adaptation and adaptive plasticity. Nat. Ecol. Evol. 1, 0084 (2017). - PubMed
-
- Paerl H. W., Huisman J., Blooms like it hot. Science 320, 57–58 (2008). - PubMed
Publication types
MeSH terms
Substances
LinkOut - more resources
Full Text Sources
